I’m a relative newbie to Knime and I have a problem I can’t seem to find a solution to anywhere.
I’m working with some drill hole data and wish to combine a bunch of data types into one file so I can compare them.
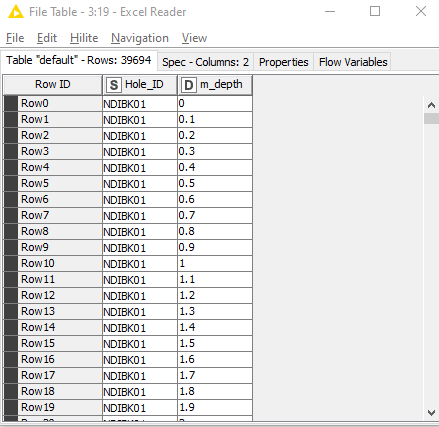
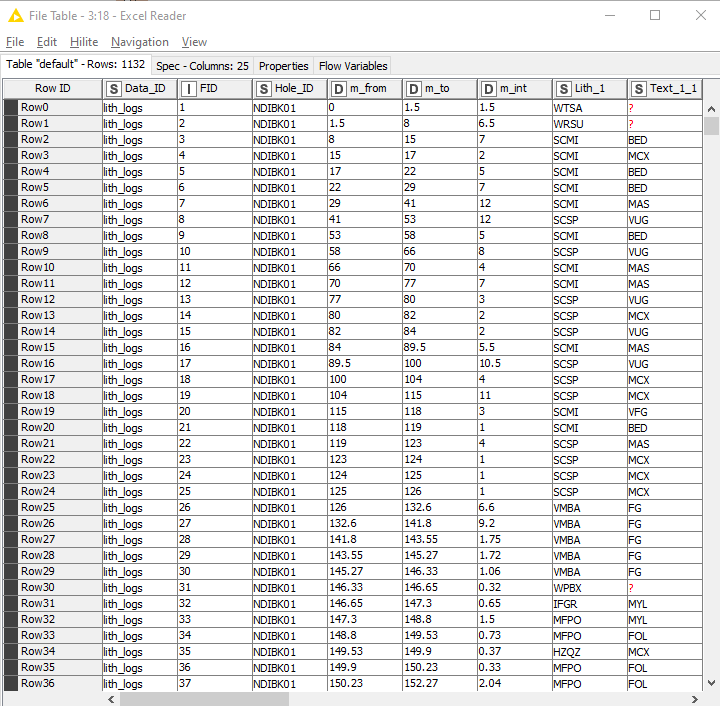
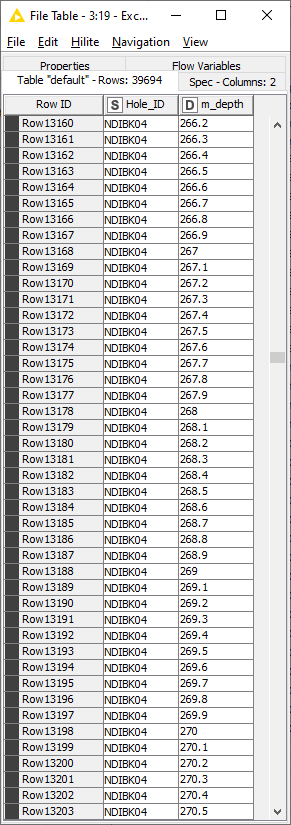
Each dataset contains a drill hole identifier (Hole_ID) and the down hole depth of the data I want to compare - either m_from, m_to for interval data or m_depth for point data.
I’d like to combine my datasets into a single file with all data types represented at points every 10cm down hole. For this, I’ve created a table with each depth value for all the holes.
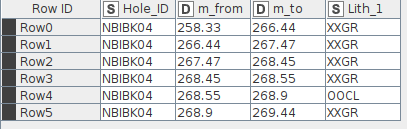
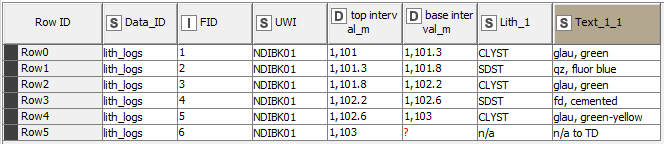
I’d like to start by taking the geological logs (below), for which the data is in intervals and generating a file that will show what the logged data is at each 10 cm interval.
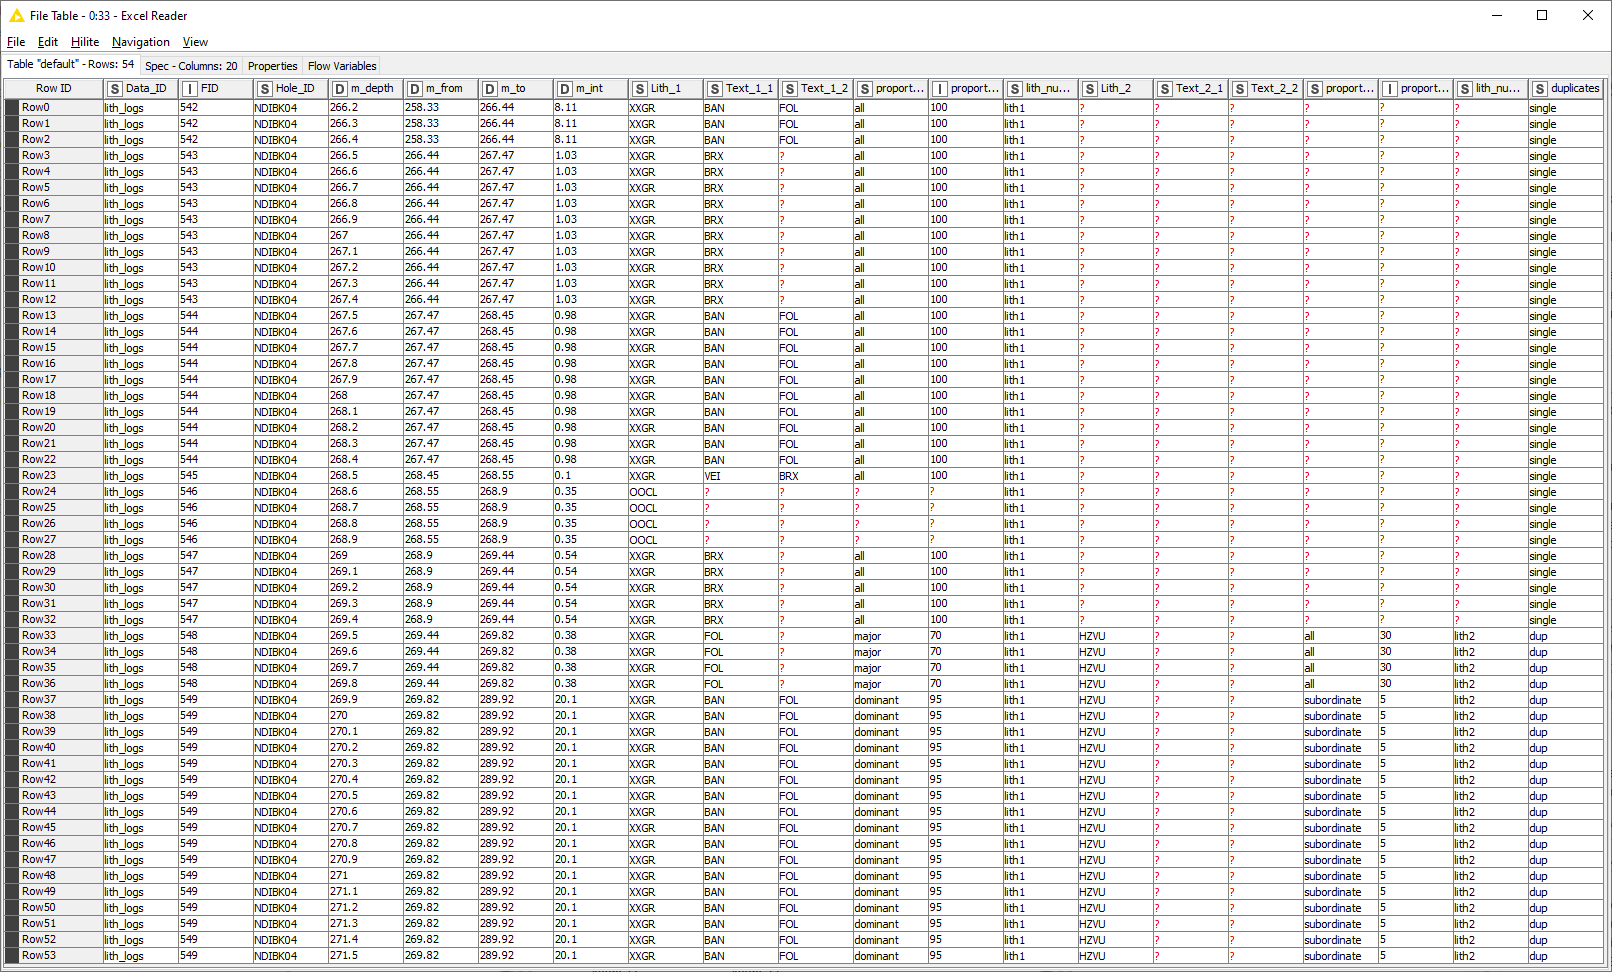
Once I’ve done this, I have a bunch of other datasets (XRF geochemistry, magnetic susceptibility, density, conductivity and others) to combine so that I will eventually have a table where each row represents a point (every 10 cm down hole) and has all the available data at that point.
Hello @richill79 and welcome to the KNIME community.
I’m glad to see some people researching in Geosciences around. I seems that, your first task is about data mining ETL aiming to gather the data from different sources; these are a simple simple tasks that you can achieve by using KNIME.
It, would be easier from your side to provide some data samples or mock ones and explain your desired output on every task. Then, for the people in the forum will be more easy to provide solutions.
For the Geo data that you showed in the picture, you need to define your rules for the intervals first, if top or bottom is included (from >= “m_from” to < “m_to” or vice versa) to work from one of these columns (a desired output).
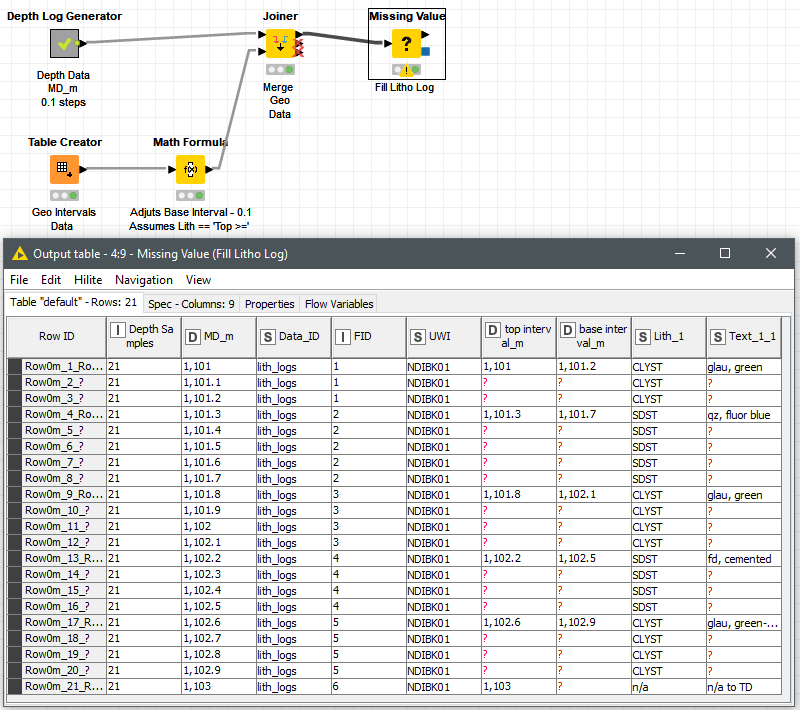
Then a Join with your depth log, with ‘depth’ as matching criteria. Your next task would be to fill the gaps, that can be achieved i.e. with a ‘Missing Value’ node with ‘previous value’ (or ‘next value’) configuration as your lithology is expected to be constant all along each of the intervals.
I’ve mocked part of a table (I made this in excel) with the sort of outcome I’d like and chose a section of a hole with enough variation for the example.
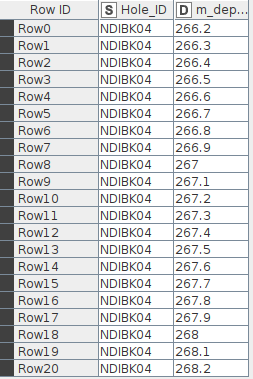
Pic 1 - input depth points table
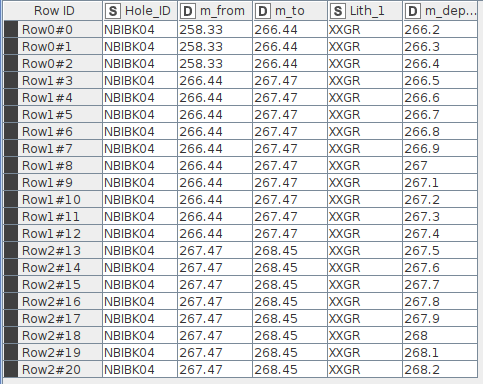
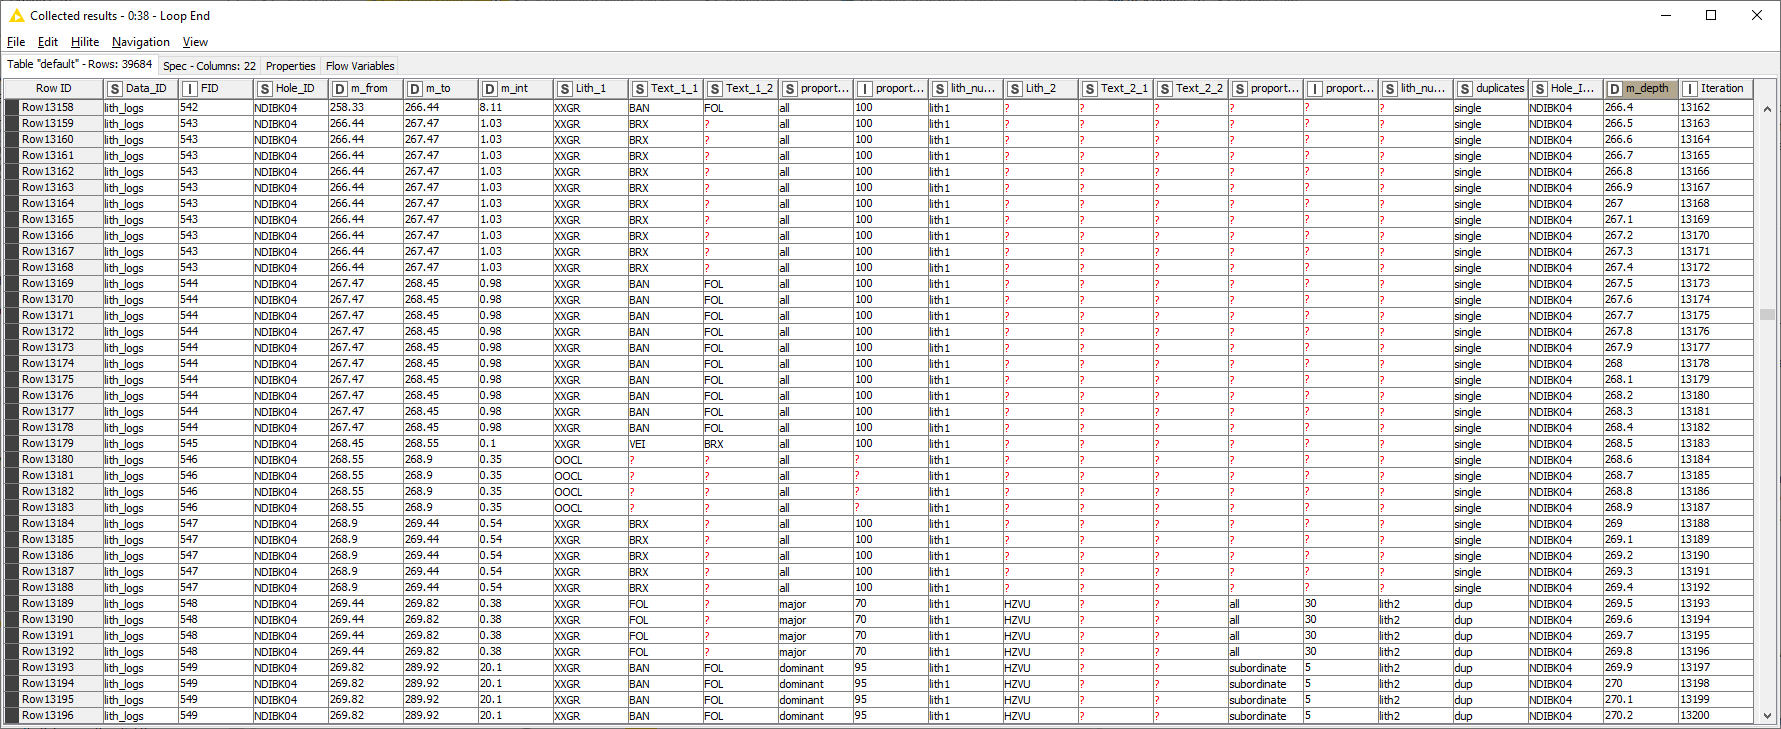
Pic 3 - combined output. I’ve left the m_from, m_to columns left in for the example. There is now a m_depth column with a point every 10 cm and the logged data at that point.
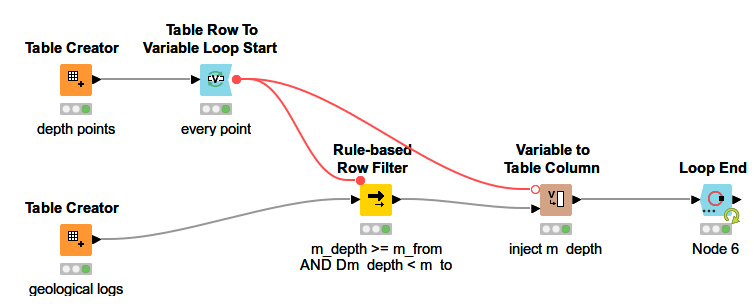
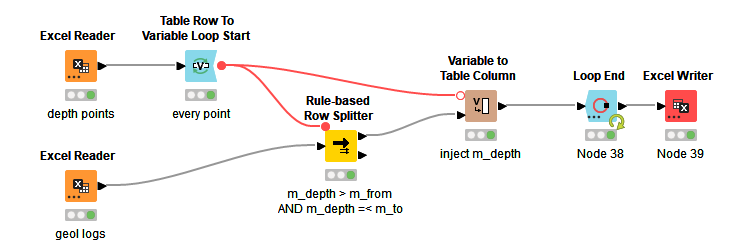
The loop processes all entries in the depth points table and returns the matching entries from the geological logs. In case of different Hole_ID, these would have to be included in the Rule-based Row Filter as an additional criterion.
Thank you @Andrew_Steel, with a few adjustments that seems to have worked!
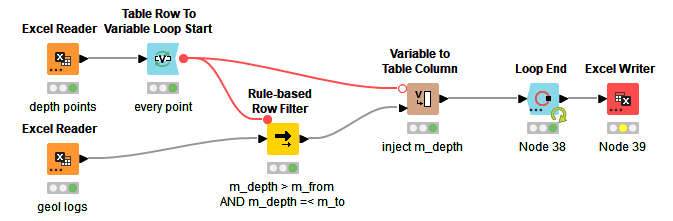
I needed to use a row filter instead of a splitter. This was the flow that got me there:
just for the sake of interest. Are you sure you want to use the splitter instead of the filter? The splitter also gives a different result at output port 2 for each loop pass. If it’s about finding the data that could not be merged, you would have to join the output from the GeoLogs table with the output of the Loop End. But then a filter instead of a splitter is sufficient.
Ok, I re-did it with the filter and it gave the same result (except is one row shorter for some reason). This works too:
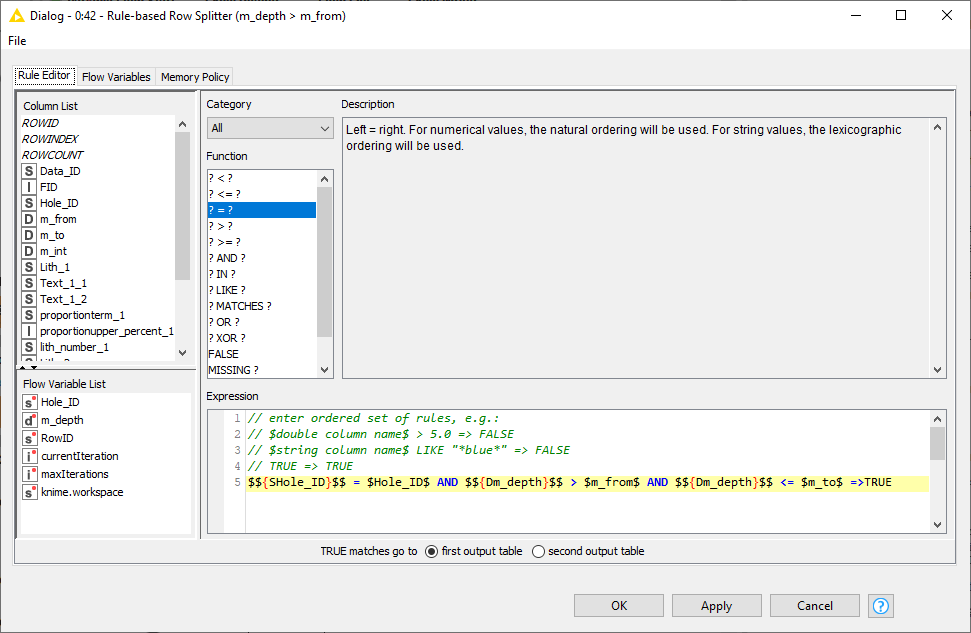
I think my original issue was the rule I was putting in, as I kept getting the wrong result and went for the splitter instead. I was trying with this (which didn’t work):
Sorry for my late answer and just to address your comment:
I was assuming this is the standard but when you can’t assume other people know business rules. Then interval description comes in conflict.
@Andrew_Steel 's solution works perfect. But sometimes it’s better avoid loops for large datasets as they become inefficient. Just for the records, an outer left joiner can do the job too as in this example.
Thanks @gonhaddock , that worked too. I modified your workflow and used it to combine my different datasets into one table.
Sorry for the late reply, I stepped away from this for a few days.
Cheers!