Hi,
I am generating multiple histogram charts via a loop and the histogram node and I would like to change the color of the bars… could not find the relevant CSS styling rule.
Any suggestion?
Thanks
Ludo
Hi,
I am generating multiple histogram charts via a loop and the histogram node and I would like to change the color of the bars… could not find the relevant CSS styling rule.
Any suggestion?
Thanks
Ludo
Hello @zioludo,
using CSS is possible, but quite messy :
.nv-group :nth-child(1){
	fill:blue !important
}
Of course, you can select cases with this pseudo-class :
tr:nth-child(odd) or tr:nth-child(2n+1)
Details : :nth-child - CSS : Feuilles de style en cascade | MDN (mozilla.org)
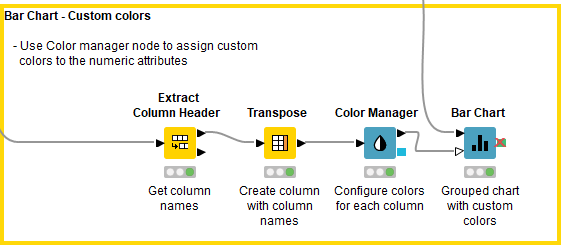
In my opinion, you should use the “Color Manager” node which is more easy to maintain in time. Indeed, Knime will automatically attribute a new color to new columns, which is not true with CSS, you would have to add new colors in the CSS code every time. The other great option is to choose a “gradient color” for numerical / Range fields :
You can refer to this post :
Or to this Workflow :
It’s not very complicated ![]()

I hope it helps.
Br,
Samir
Thanks a lot!
Looking at SVG string I figured the bar classes… but got the syntax of CSS wrong.
Eventually I did change SVG to String and used string manipolation to replace the default colors.
Color manager was not working specifically with Histogram node but I would read the other suggestions!
L.
This topic was automatically closed 182 days after the last reply. New replies are no longer allowed.