Hello @zioludo,
using CSS is possible, but quite messy :
.nv-group :nth-child(1){
	fill:blue !important
}
Of course, you can select cases with this pseudo-class :
tr:nth-child(odd) or tr:nth-child(2n+1)
Details : :nth-child - CSS : Feuilles de style en cascade | MDN (mozilla.org)
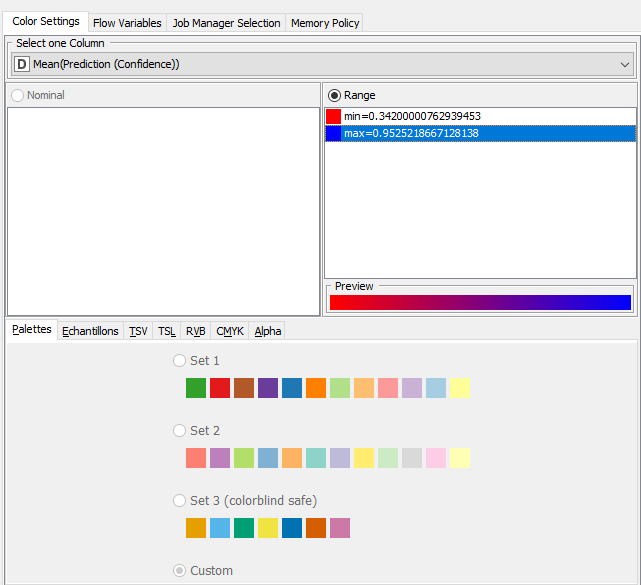
In my opinion, you should use the “Color Manager” node which is more easy to maintain in time. Indeed, Knime will automatically attribute a new color to new columns, which is not true with CSS, you would have to add new colors in the CSS code every time. The other great option is to choose a “gradient color” for numerical / Range fields :
You can refer to this post :
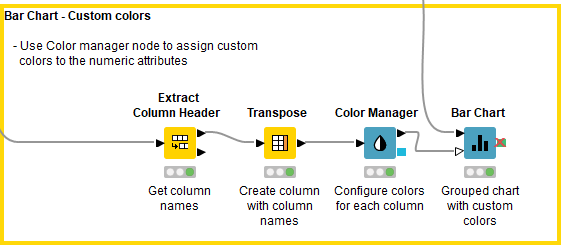
Or to this Workflow :
It’s not very complicated ![]()
PS: choose better colors
I hope it helps.
Br,
Samir