Hello,
I have curve numeric dataset and status OK/nOK based on some rules. Is it possible in Knime to use some algorithm (eg DecisionTree) to assign status according to input curve data?
Not sure I understand what exactly is your goal? If you already have rules upon you which assing status why do you need algorithm to assign status? Can you explain it a bit more?
The rules are not easy and we already have many complicated ones. From time to time we find an another issue and we have to add a new rule. It is really time consuming and it is not precisely. So we would like to add something like MachineLearning so we will not have to take care of it so much. We would like the automat will live on its own.
To be more specific we have a machine that analysis our wares. Measurements takes a long time and it produces much data curves (x axis is time). We would like to detect fluctuations that causes the problem. And if the algorithm finds the fluctuation, it will stop measuring process and set the product attribute as nOK. Right now we have the rules for this purpose. But we are sure that our algorithm can be better. But the amount of data are not easy to read for person. For this we would like to use AI.
My problem is that I cannot find out a way how to work with curve dataset in Knime. Is it even possible?
Thank you very much
think I might got it now. You are doing something like anomaly detection based on your measurements? That is definitely possible with KNIME. Check out following two links from two different industries regarding finding anomalies:
Going through above materials should give you a rough idea on how to approach it but overall doesn’t seem such an easy process to set up so in case of any questions feel free to ask!
Can you share some data to check this out ?
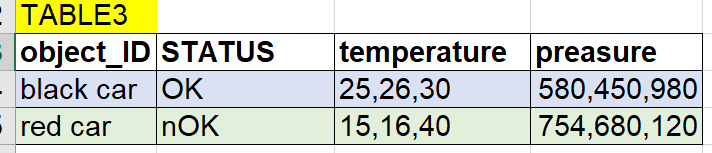
If I understand well, you identify the status based on the pressure & temperature, right ? Not on the object_id. The colours of your table are confusing because they are “saying” that black cars are okay, and red cars not okay .
Thank you very much! That’s exactly the thing that I was searching for. I will go through it and possibly I will ask you. Thank you again for your time and work.
Yeah, you are right. Object ID is just a simple ID (indicates id of testing item). Colors were chosen randomly. I only wanted to show that the data rows are related. I will think about it next time. Thank you.

 .
.