I have this dataset from Bank of England. I have cleaned all my data and am ready to analyze the dataset but I am a bit stuck. I wanted to ask, for example, one trend I want to analyze is the trend between Monthly Savings and Total Household Income. Could someone tell me how I might do that.
Some sample data would help. To start you could try a simple regression. Check the correlation.
Hello here’s the data in CSV format let me know your suggestions and if you want it in another format.
Bank of England Data.csv (239.6 KB)
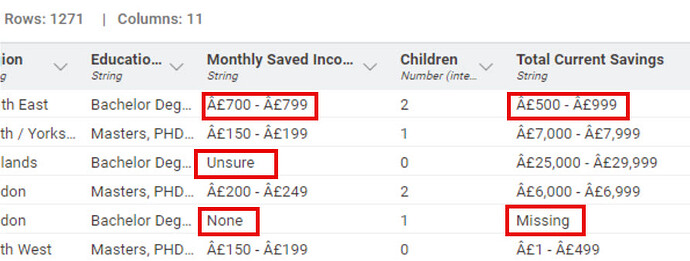
To say the least, the data is a mess. Here are a few examples:
I’m not sure what you’re trying to do, so I spent some time cleaning the data. Take a look at this workflow for my data cleaning approach and let me know if it helps.
Bank of England Data Analysis.knwf (120.2 KB)
Yeah for some reason those symbols came in when I used the CSV reader. I’ll take a look at your workflow and see if I have any questions. Thanks a lot for your help.
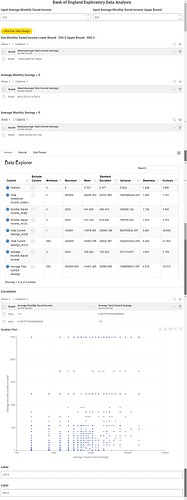
I’ve added a component which displays a variety of data. I made no attempt to develop a model. I think the data is so marginal that any model would be suspect. I made a number of assumptions, e.g. the value for each savings range is the mean of the range and the upper limit for unlimited ranges is 2x the lower limit. Any questions let me know.
@Erdem_Oruc since this is a survey I would first create variables that would represent the ordinal rank of several questions where this is appropriate.
1 - no savings
2 - up to 500 £
… (and so on)
With that you can make bar charts to visualise the questions in %.
You would then have the same bar charts by your demographic groups like age. A as an addition you could read up about tests to see if there is a significant difference in the answers.
This would be best if you have a central quality question like satisfaction or the willingness to recommend the business.
Some more hints in this article. Maybe start with something simple.
What you also could do is try to employ ChatGPT to talk about the survey.
I am thinking about building a few components to analyse such data.
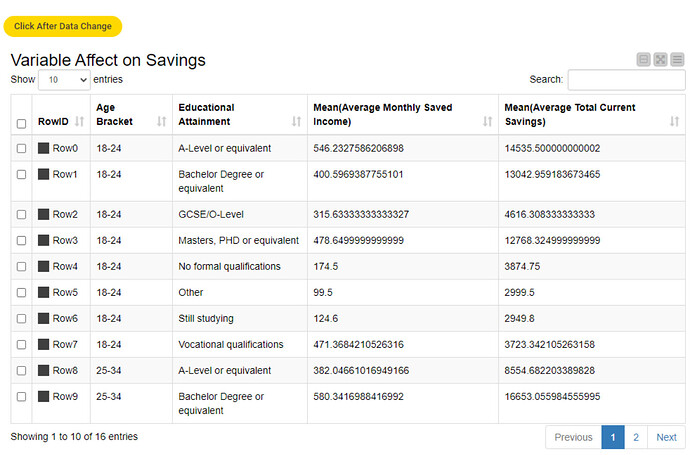
I’ve added a view which allows you to see the effect of selecting various "variables’ on the savings.
Did the workflows I posted help?
This topic was automatically closed 90 days after the last reply. New replies are no longer allowed.


