Hi,
is it possible to visualize data when working with DB Nodes without loading the data into Knime through the DB Reader Node? Since it takes some time to load all the data into Knime, I wanted to filter the data first. However, I need to visualize it first, as this gives me the information whether it has been filtered cleanly…
Hi @Shiva123, in order to “visualise” data, it would need to be loaded into KNIME. I’m not quite sure how else you mean to be able to see it.
If it’s a large amount of data perhaps you can temporarily add a limit to the number of rows returned by dropping a “DB Row Sampling” node into the workflow and limit the rows returned to, say, the first 100 or adding some other filter conditions, but there isn’t a tool out there that can somehow show you the data without actually downloading it.
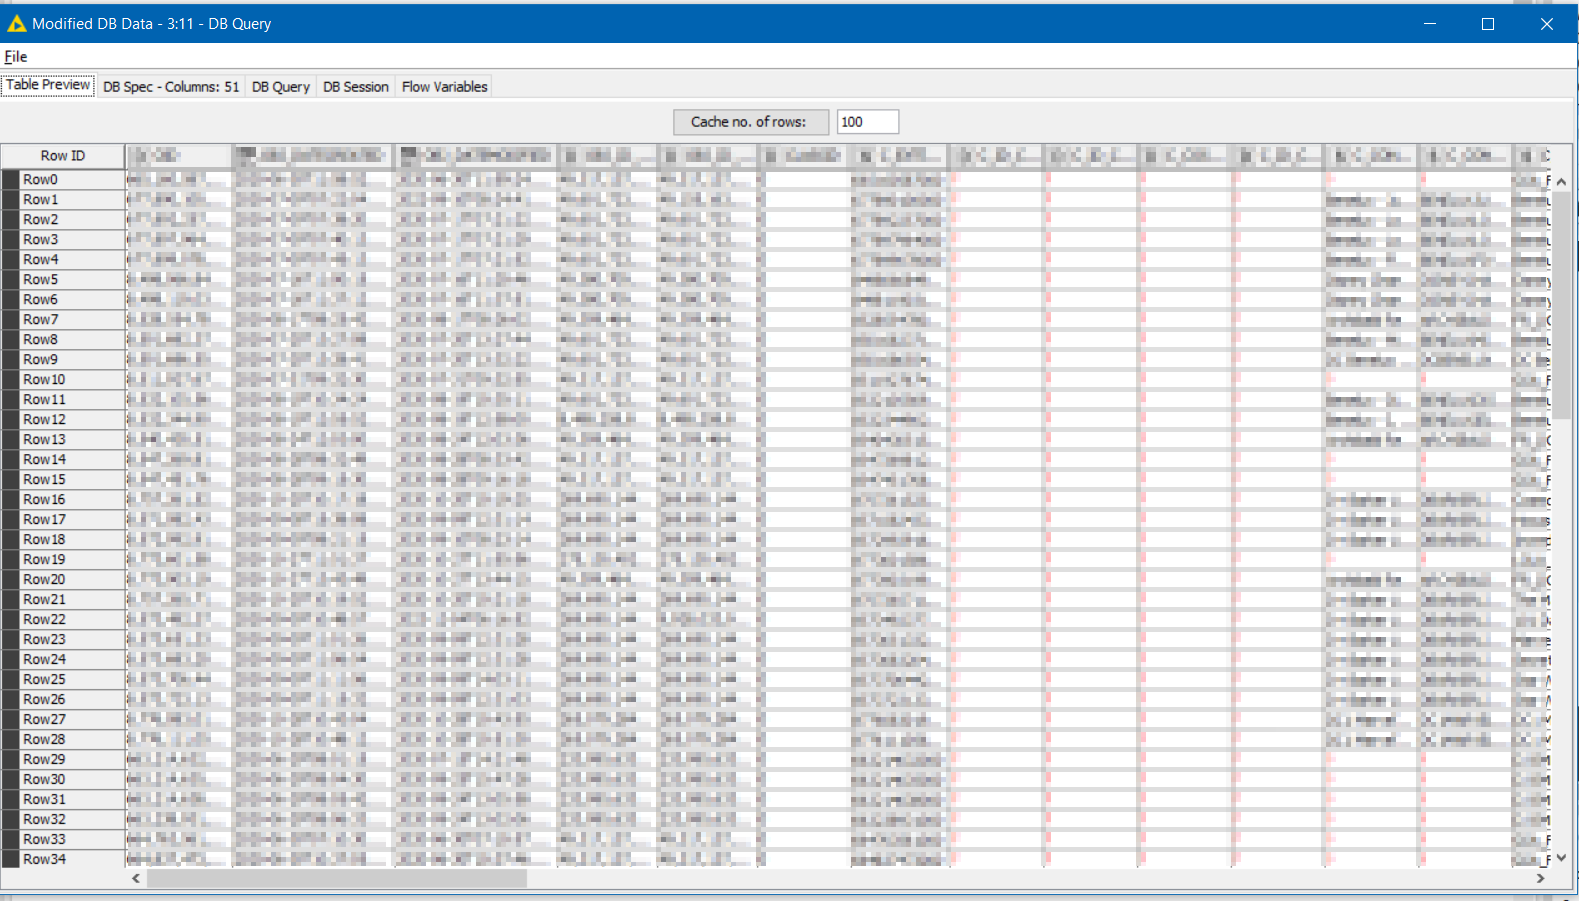
Edit:~ on some nodes, such as DB Query, you can inspect a small cache of the output at that point
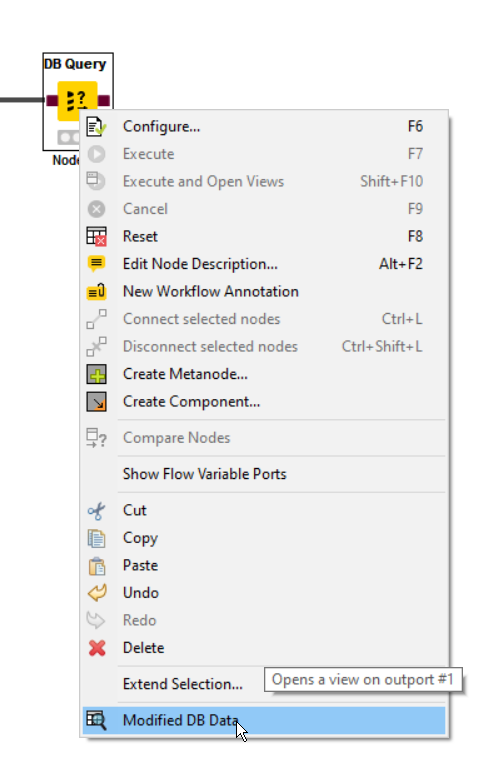
and then you can request it to return a number of rows from the database, but of course it still has to execute the query to achieve this, even if it is only going to return a limited set of rows. Maybe that is what you are looking for?
I apologise if I am misunderstanding the question. What else did you have in mind?
3 Likes
H @takbb , I want to filter data based on certain values/thresholds. Since I can use a scatterplot to track the correctness of the filter due to linearity, I wanted to visualize the data accordingly. Since I reduce the amount of data enormously through filtering, I wanted to do this before the DB Reader Node or before I load it into Knime… Hence the question as to whether I can somehow get the data visualized before it is loaded into Knime. The alternative would be to filter the data according to the DB reader node, but loading the data would take Knime a very long time…
This topic was automatically closed 90 days after the last reply. New replies are no longer allowed.