Hi friends
I would like to talk about “Random Forest” and “Decision Tree.”
This post is purely for study purposes.
Let’s go!
I have watched several videos on this topic, many of them from Knime itself.
Recently, I watched a video by Scott Fischer, which was quite entertaining, by the way.
In Knime’s examples, there’s one related to diseases where age and body fat percentage are compared with heart disease.
In these examples, I noticed that several variables (columns) lead to two distinct outcomes.
For example:
Age + Body Fat + Family History + etc. + etc. = Heart Disease YES
Age + Body Fat + Family History + etc. + etc. = Heart Disease NO
But since we select a “target column,” could I simulate the calculated value of a mathematical formula?
For this reason, I thought of conducting a practical test related to my field of work.
This test is just a simple mathematical calculation that results in an expected value based on a mathematical formula for all columns.
Let’s look at an example:
I thought—if I create a mathematical calculation with a logical rule, only changing the values of quantity and unit price, but define a column as a string to categorize the obtained result—could I identify which columns are “YES” and which columns are “NO” without having a calculated column defining the result?
Analyzing the Table:
Data base 1
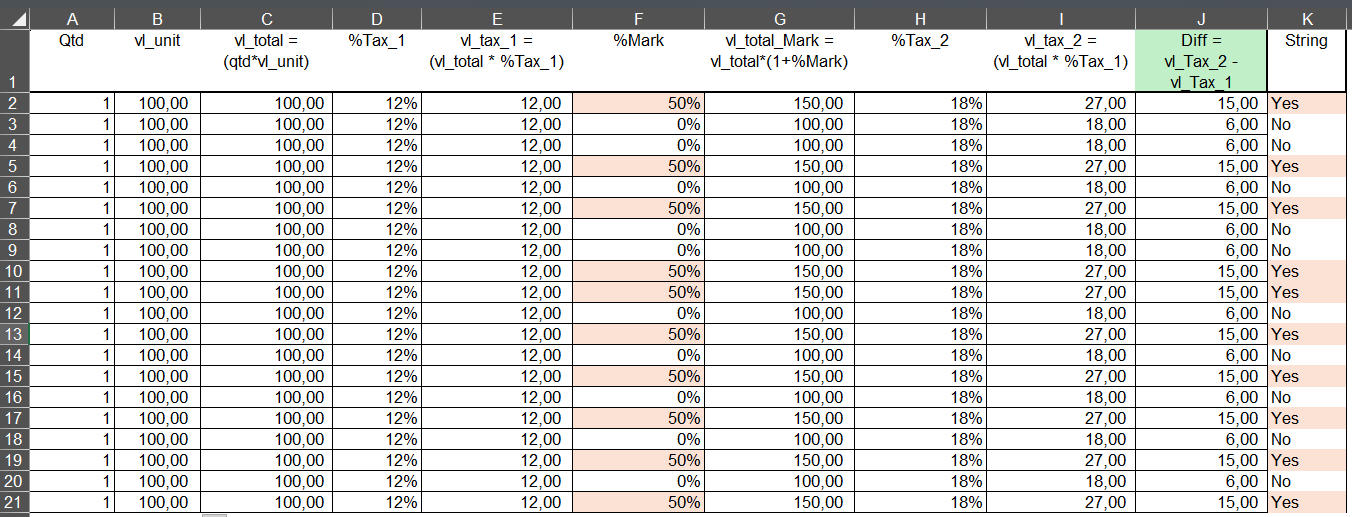
Check print 1: a table with a mathematical calculation.
- Column 10 represents the last step of the mathematical calculation.
- Column 11 is a string column that checks whether the value in column 6 (50%) is greater than zero.
- If greater than zero → YES
- Else → NO
Notice that the value in column 10 is always higher when there is 50% in the calculation.
With this, I started the Random Forest model, considering all columns.
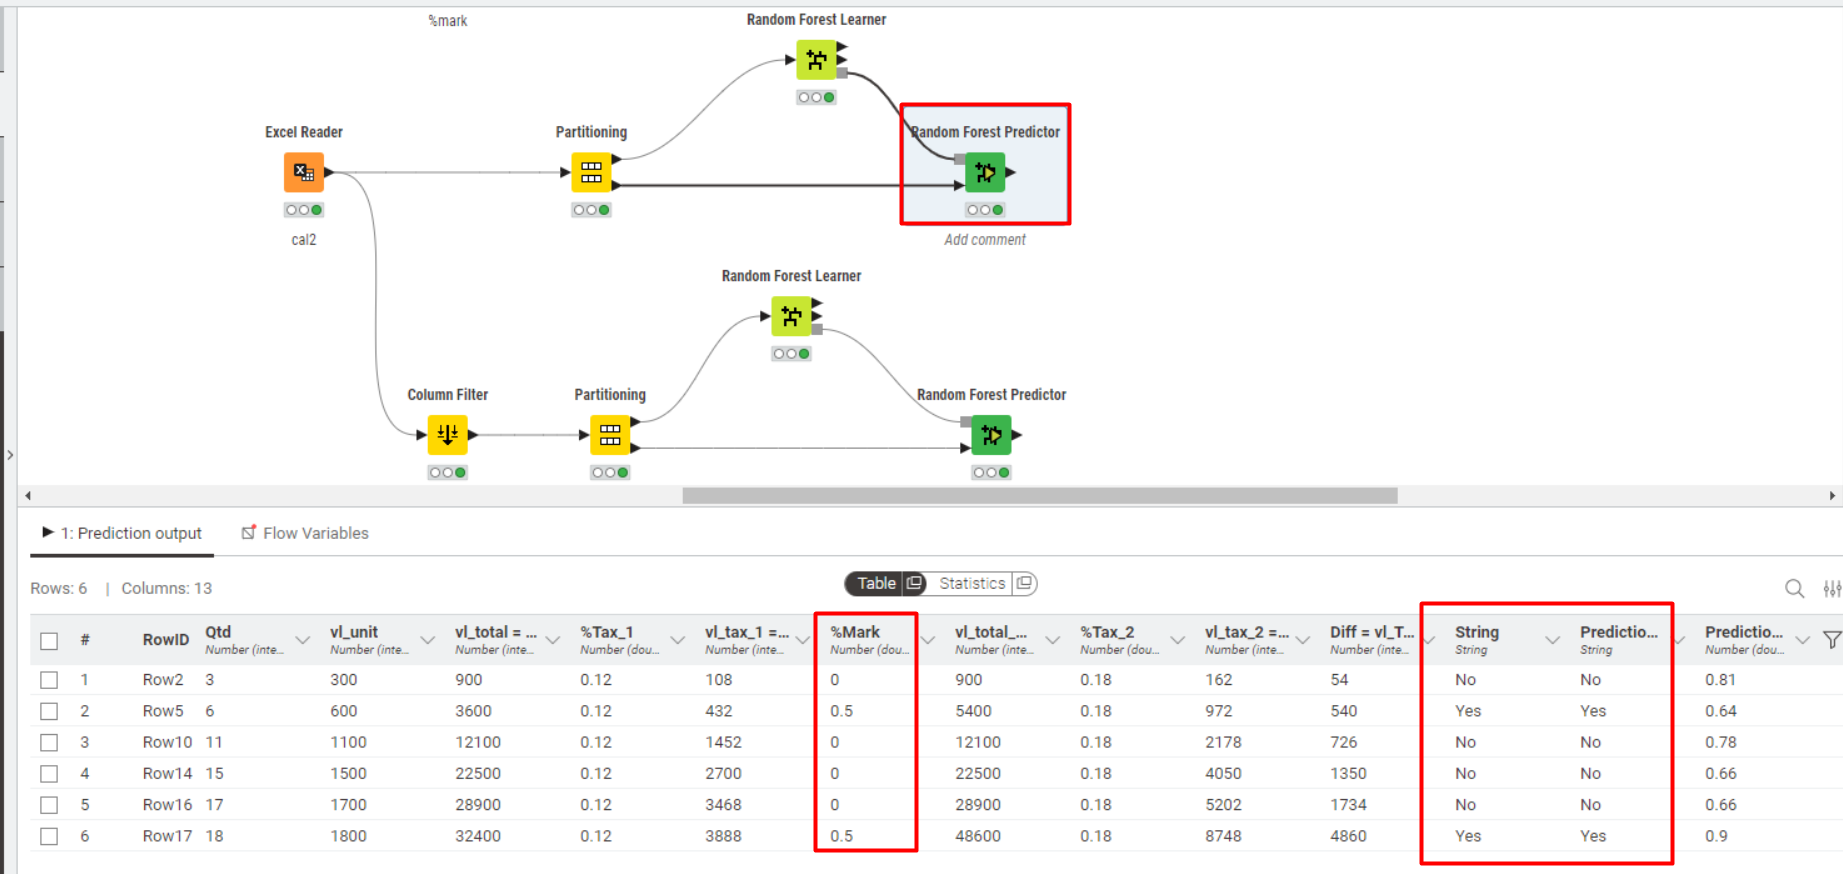
Test 1 - All Columns
In this test, the predictor node correctly classified all cases.
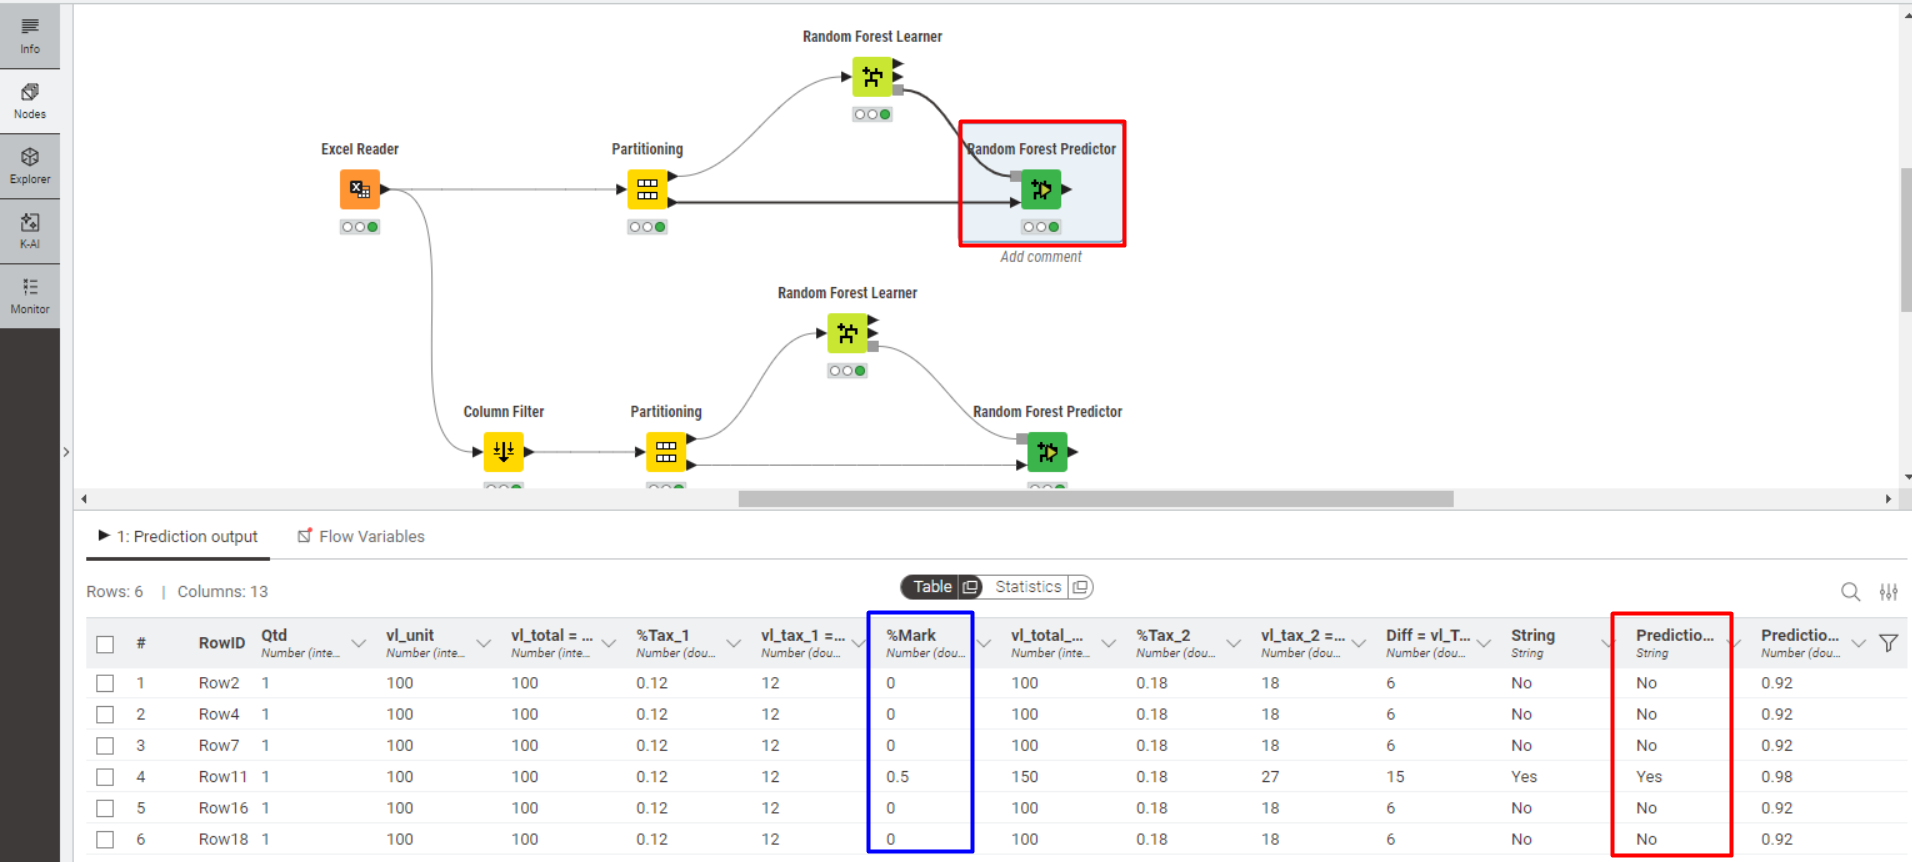
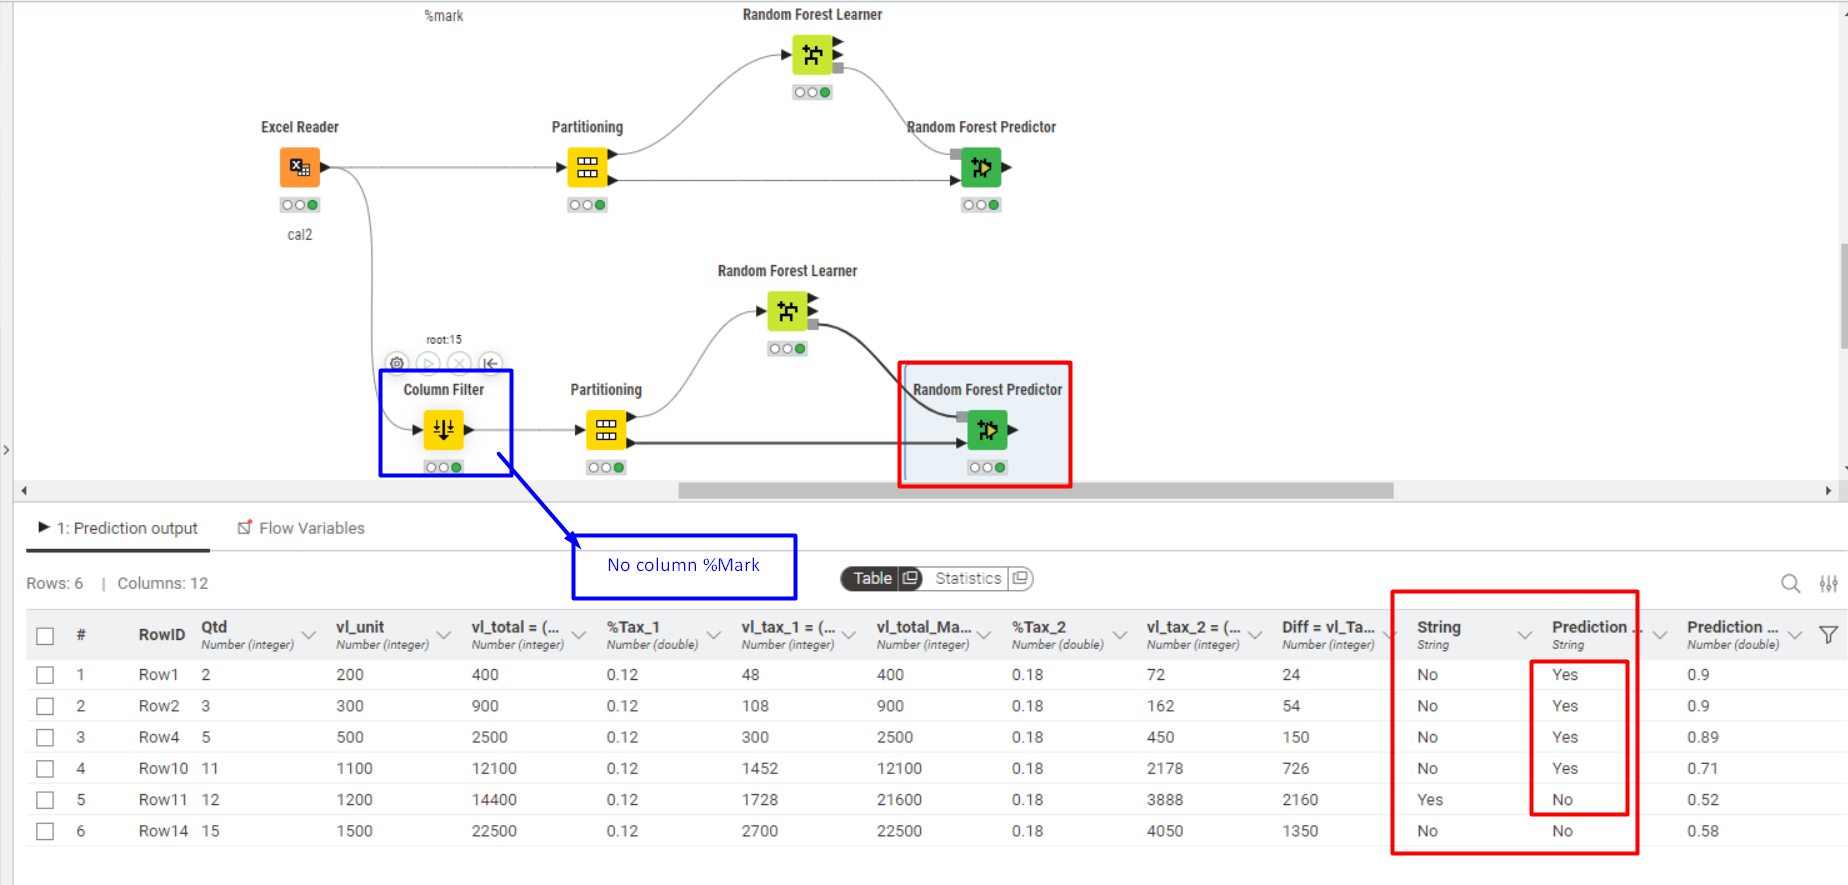
Test 2 - Without Column %Mark
In this test, the predictor node also correctly classified all cases.
If I stop here, it is clear that the Random Forest correctly predicted the final outcome, considering the columns.
I envisioned this scenario assuming that, in a new dataset, I would not have the %Mark column in my data.
Then I thought—could I still predict the outcome using only the remaining results?
So far, yes.
Now, let’s continue with another test, but this time altering the quantity and unit price of the items while keeping the same mathematical formula.
I created another file and modified the quantity and unit price for each item, making the dataset less standardized compared to the first case.
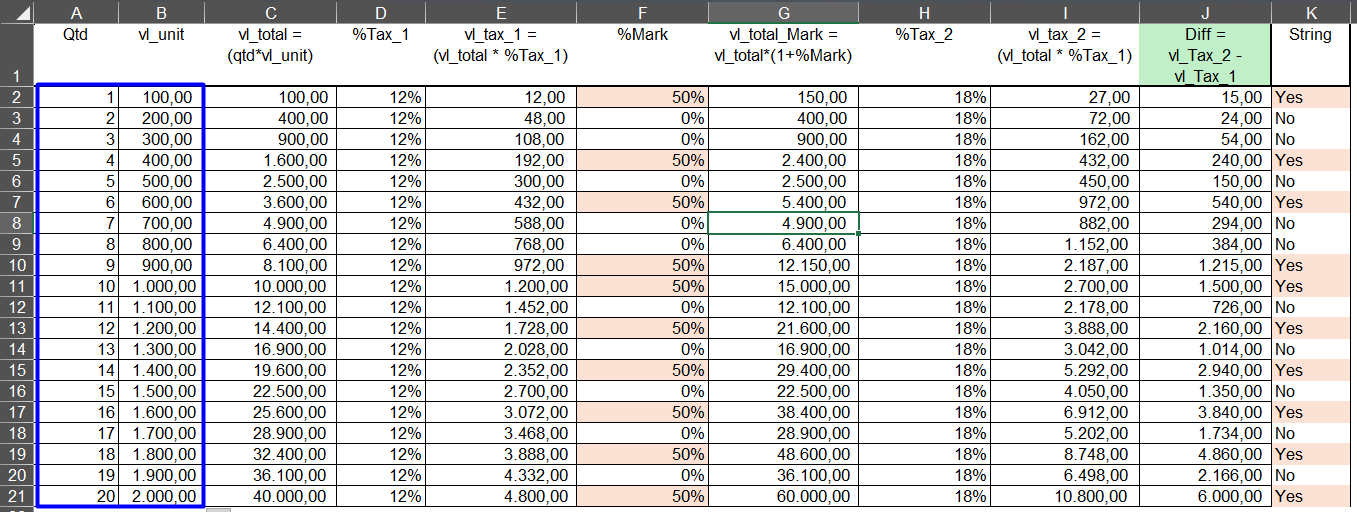
Notice that the final values are quite different, but mathematically they make sense.
Test 1 - Keeping the %Mark Column
Random Forest correctly classified all cases, even with a less standardized dataset.
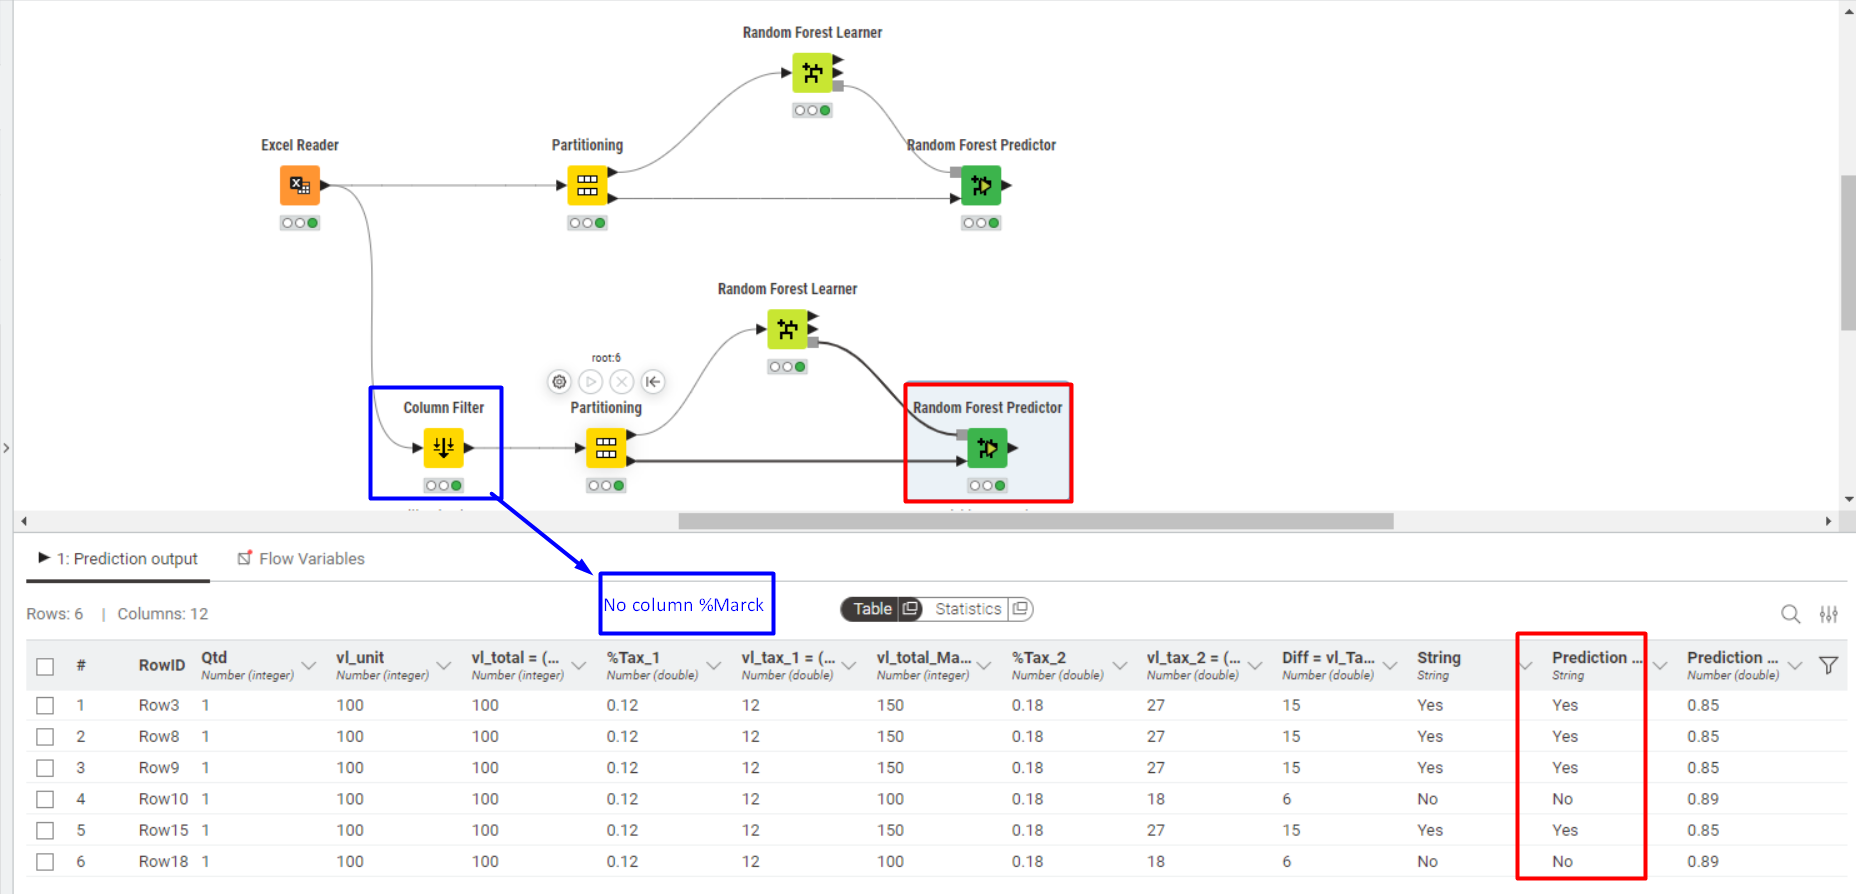
Test 2 - Excluding the %Mark Column
Random Forest did NOT correctly predict the final outcome.
In this case, I believe that since the dataset became less standardized and no longer contained a key column for comparison with the string (target) column, this might have been the reason for the incorrect predictions.
Summary:
Perhaps I need more rows in the partitioning step.
PS: I’m using 70% > 30%.
Teste-Decision Tree.knwf (122.5 KB)
Question: I would like to know why, in the last case, the result was not as satisfactory.