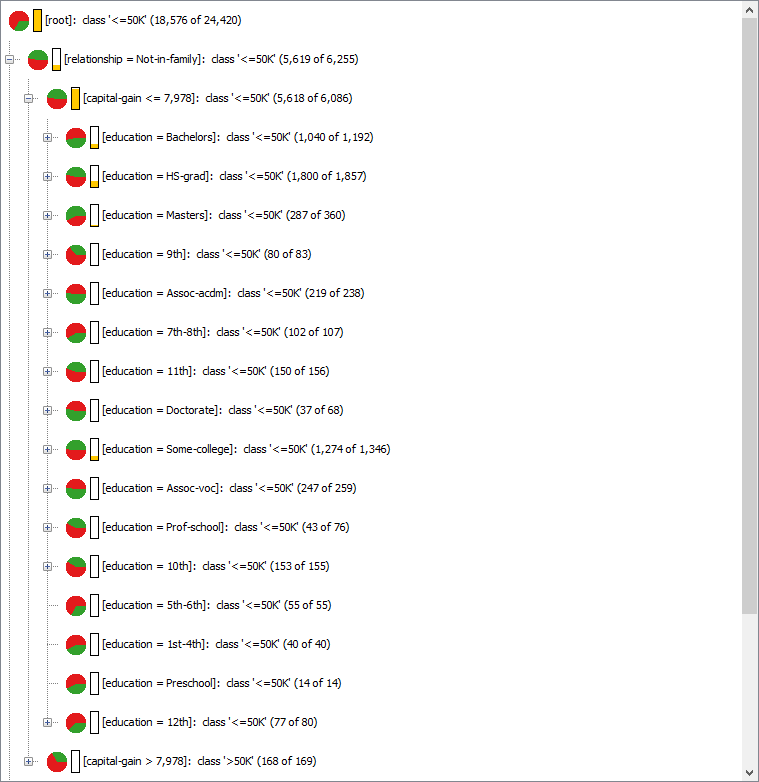
The Decision Tree Learner node itself supports a vertical view - you can see this by right-clicking the node and selecting View: Decision Tree View (simple).
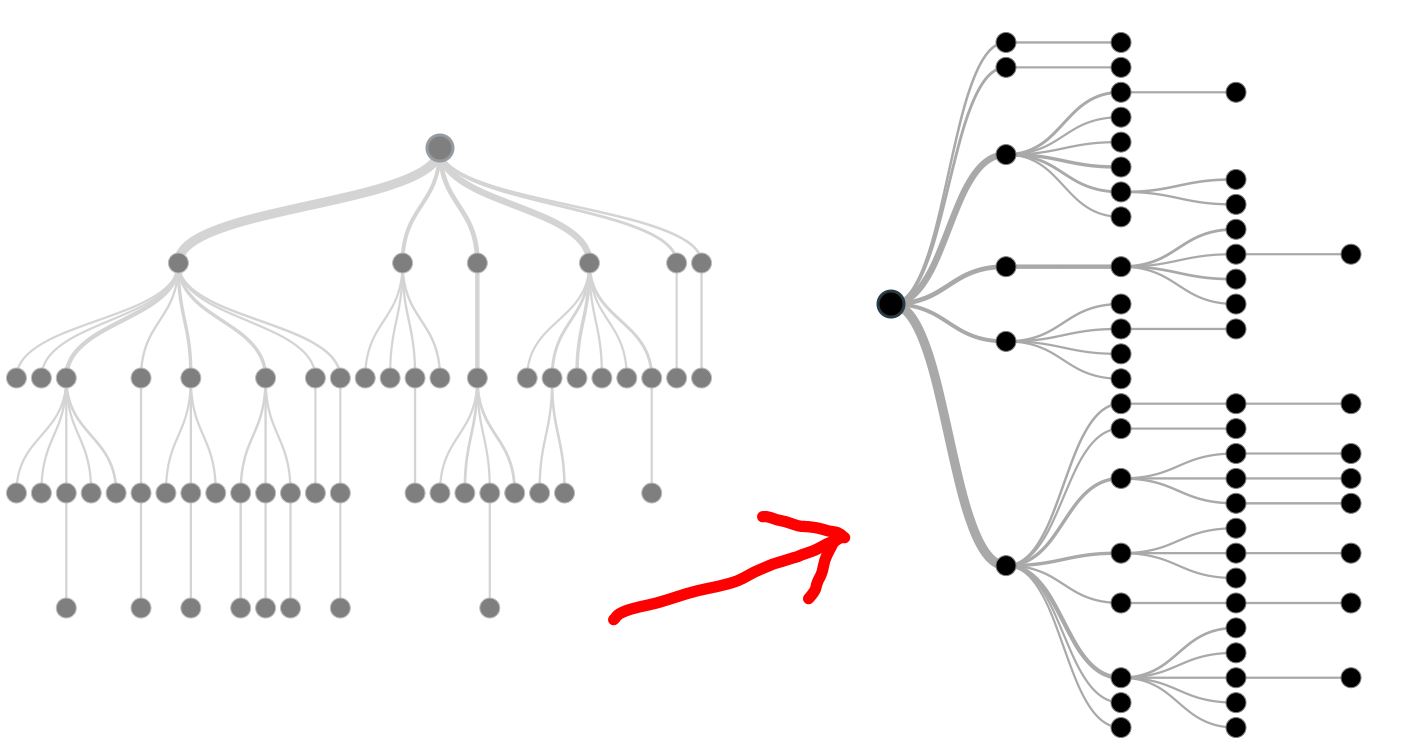
You can drill down through the branches of the tree, and export a PNG if you like. Here’s an example: