Hi, i just started working with knime and I would like to know if I am making classification trees correctly
Hi Adrian,
welcome to our forum and happy that you started to work with KNIME. Good Decision!
Without knowing what you’ve done so far it’s hard to tell if you are on the right track. So if you don’t mind please share some details.
As a start you can have a look on this one here:
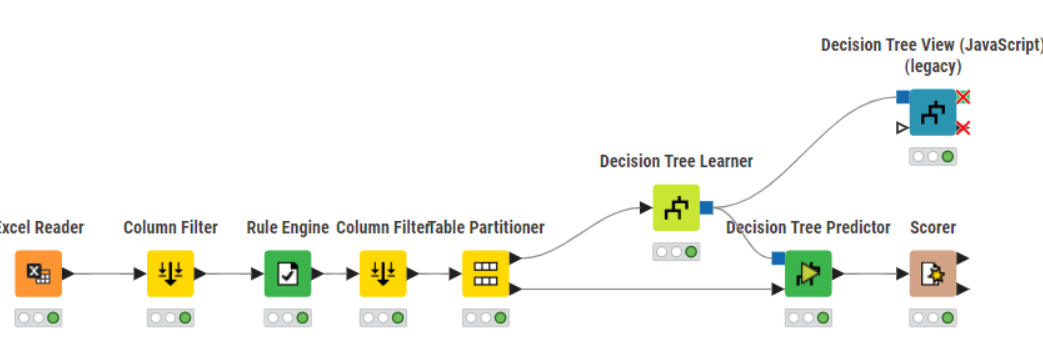
It’s a brilliant minimal example for Decision Tree Training
Best
Andreas
3 Likes
@AdrianGrabowski you can check this example with a Decision Tree and some exports around it.
If you want to learn more about Machine Learning you can check this article:
1 Like
I’m sorry, I couldn’t post photos because I got a message that my account is on hold. Could you check this screenshots?
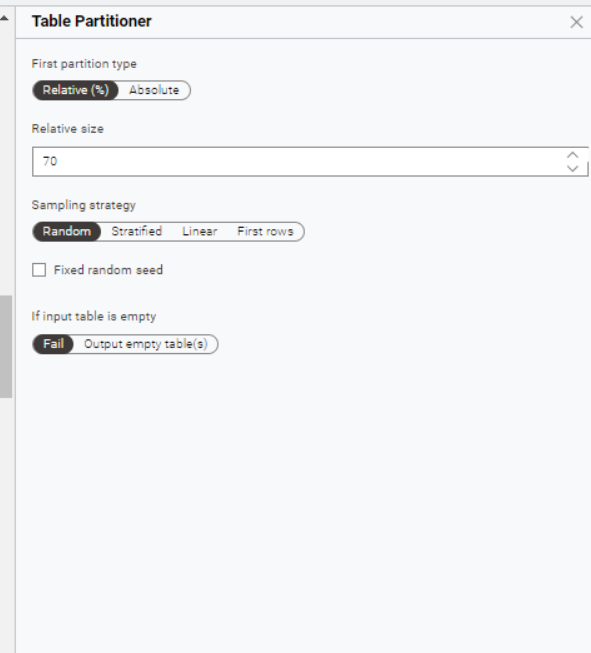
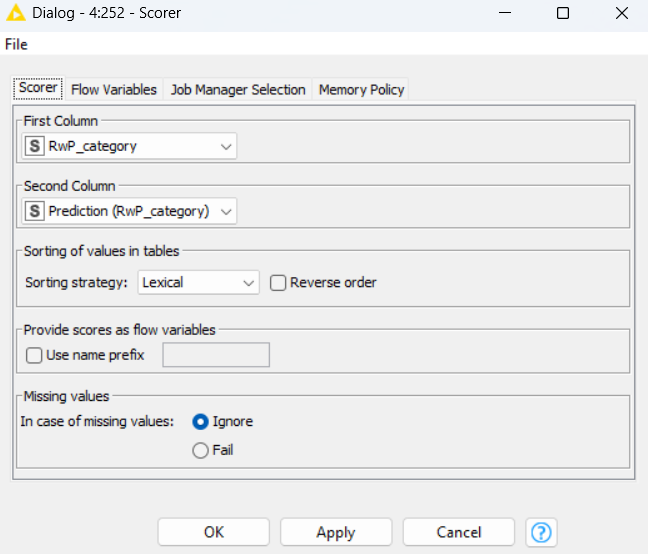
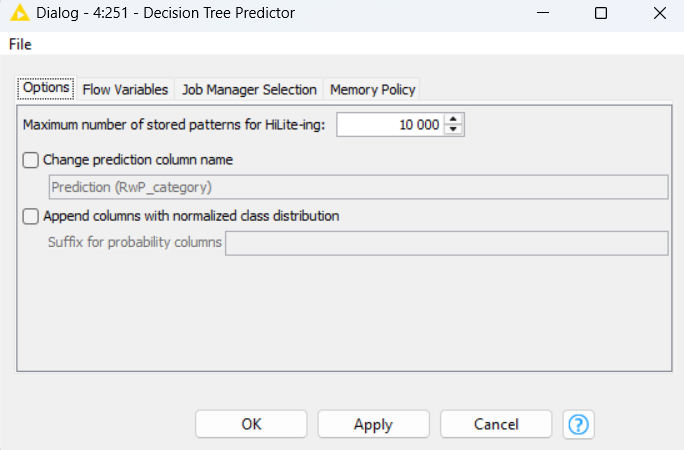
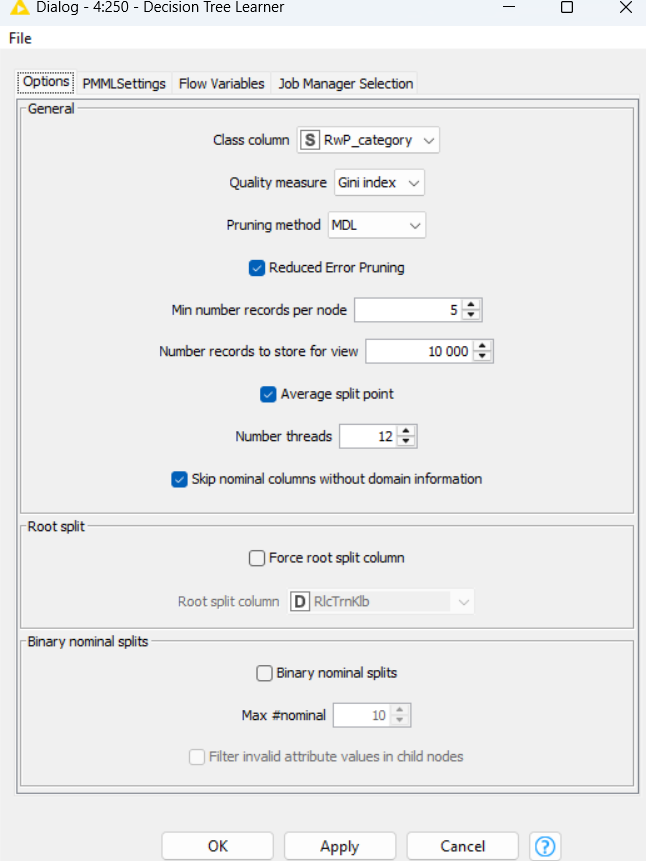
Yep. Everything looks reasonable
Keep in mind that the settings for the learner must be adapted to problem. The provides settings are good starting point. Nothing more
Please check the Medium article from Markus @mlauber71 for further details
1 Like
@AdrianGrabowski you should take a look at the Binary Classification Inspector – KNIME Community Hub and try to understand if your model does what you want for your business case once you set a threshold.
1 Like
Thank you for your help and support. It will definitely be useful. I have one last question: why can r^2 be negative? In all interpretations, it is always in the range 0 to 1.
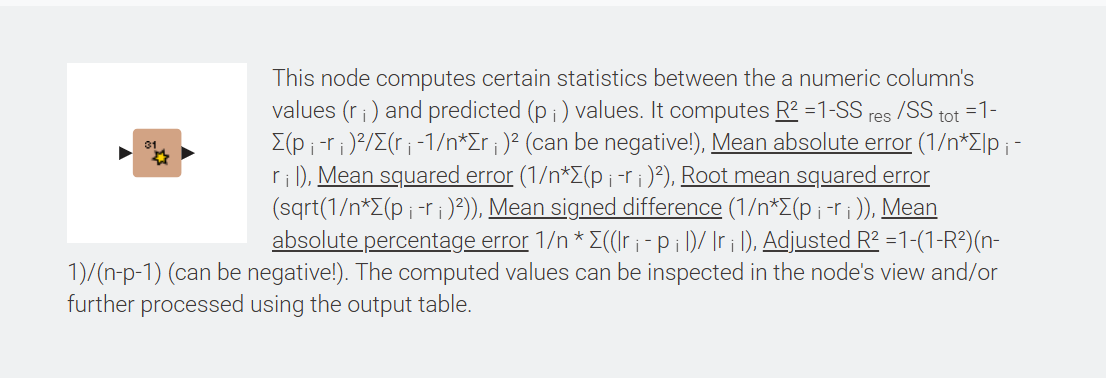
If R² is negative, it means the model predicts so poorly that its errors are larger than if you had simply guessed the mean of the data.
For example, this can happen when the predictions are completely off, e.g having the wrong scale, wrong direction, or too little variation.
gr. Hans
1 Like
In this case it just means that the residual error SSres is bigger than the total error:
Residual error:
SSres → shows the deviation of each predicted value to it’s real value
SSres = (y_i - y_i,real)²
Total error:
SStot –> shows the deviation of the variance
SStot = sum(y_i - mean(y,real)^2
So it’s possible to have a poorly fitted model which has this behavior.
It is intriguing that R^2 has entered the discussion here, even though the topic is about classification and decision trees. Not saying that you can’t or should not calculate pseudo-R^2 based on log likelihood compared with a so-called null model, just saying that there are other perhaps more informative metrics offered by KNIME’s Scorer node (and others) to assess the quality of a classifier, eg AUC, Cohen’s Kappa, Markedness, Informedness, etc.
2 Likes
This topic was automatically closed 90 days after the last reply. New replies are no longer allowed.