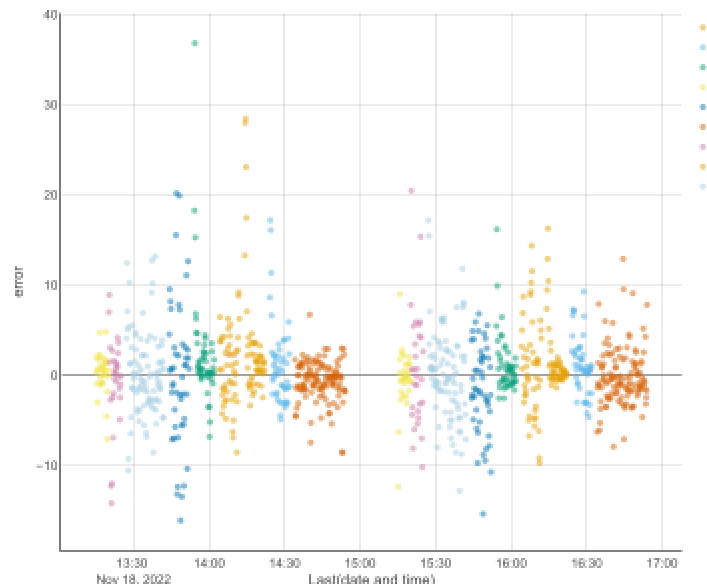
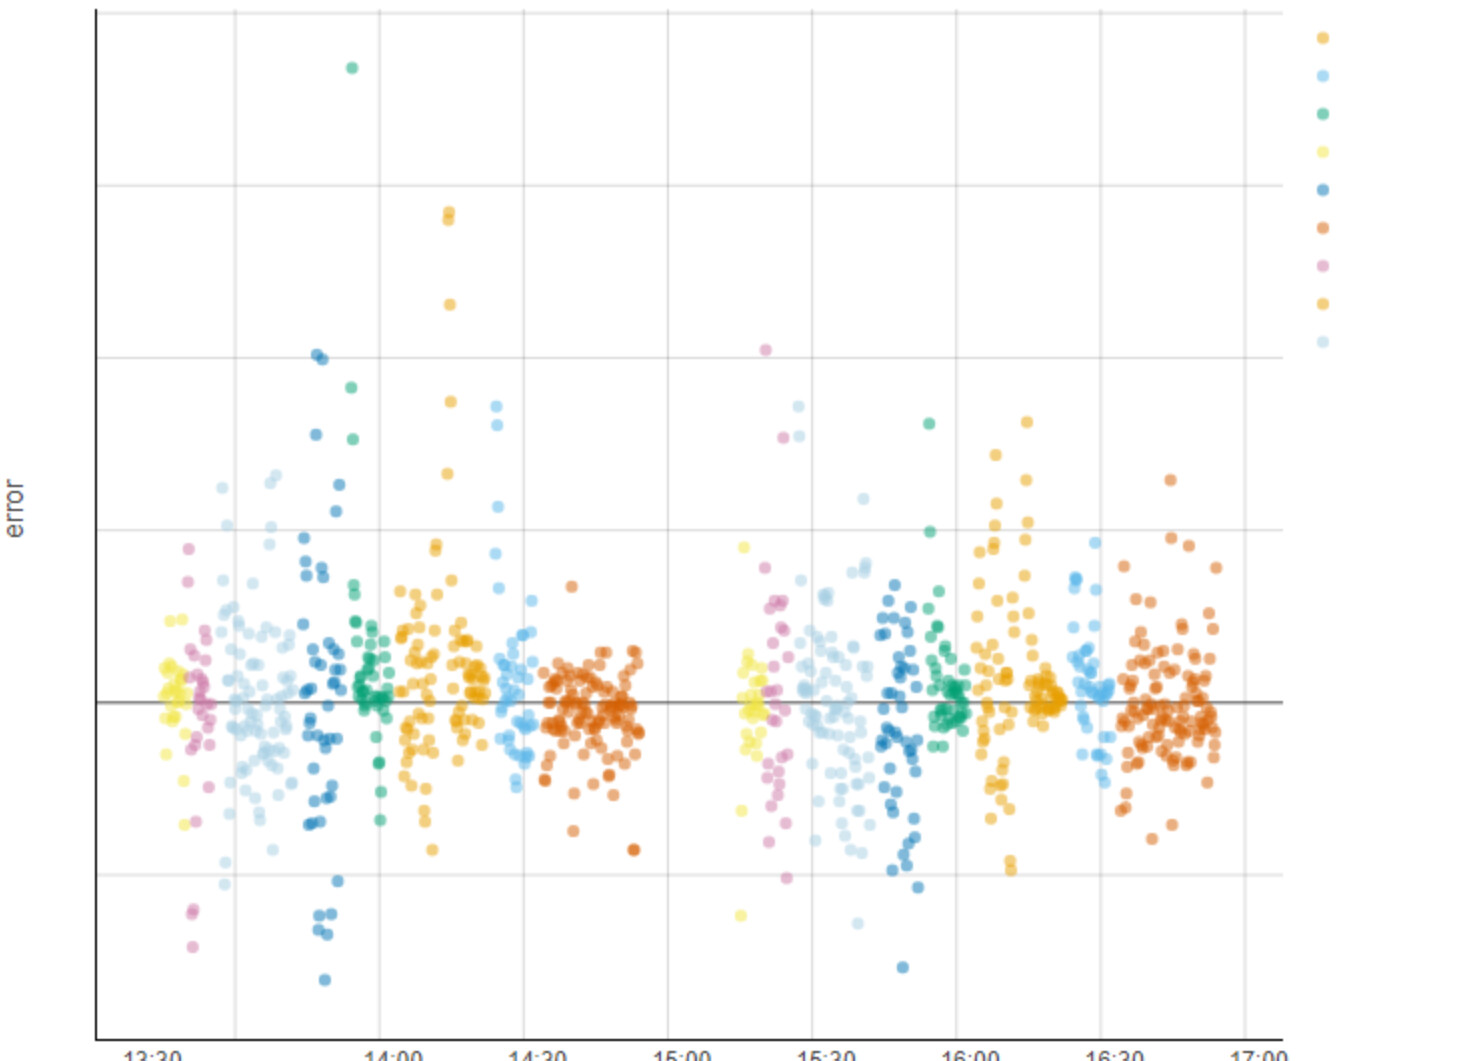
I have generated a table with images using a loop. All images look fine at the loop end. Attaching the Table View node so that the individual images would appear using the “Interactive view: Javascript table view”, but the y-axis tick values disappear. My OS is Windows 10 Pro, Version 10.0.19044
I don’t seem to be able to reproduce your issue, which KNIME version are you currently using?
Would it be possible for you to provide your workflow with dummy data?
Just to be clear, are you still experiencing the problem, or were you able to work around it? If you’re still having trouble, can you provide an example WF as Daniel mentioned above?