Hello everyone,
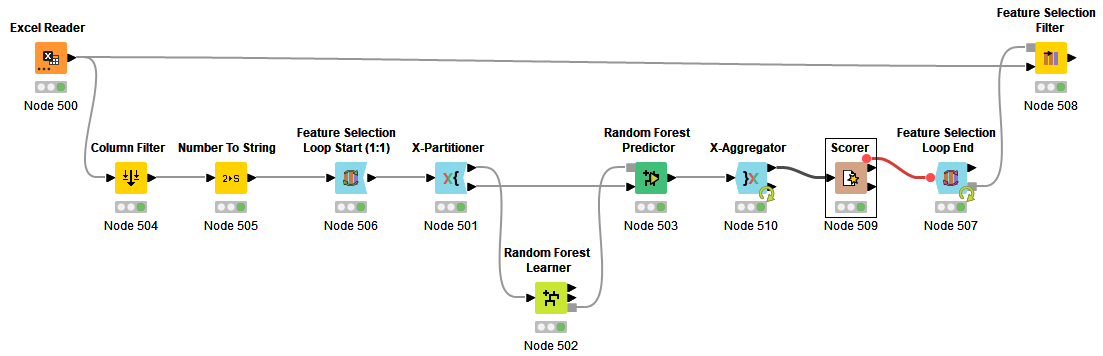
I’m trying to classify whether a patient has knee cartilage degeneration or not. It’s a binary classification and I’m using a random forest classifier. Using the ‘Scorer’ node, I can analyze the ‘accuracy statistics’ (accuracy, sensitivity, specificity, kappa value, etc.) very easily.
Instead of using all features, I use feature selection method (genetic algorithm). After the “Feature Selection Loop” completes, in the “Feature Selection Filter”, it displays the accuracy of the different feature set results (best to worst accuracies).
I was hoping to get the sensitivity, specificity, f-means, etc. (just like the output of ‘Scorer’) after feature selection is done, so I can analyze the result of the best selected model using more evaluation metrics (instead of just accuracies) .
Any help would be much appreciated. Thanks in advance.
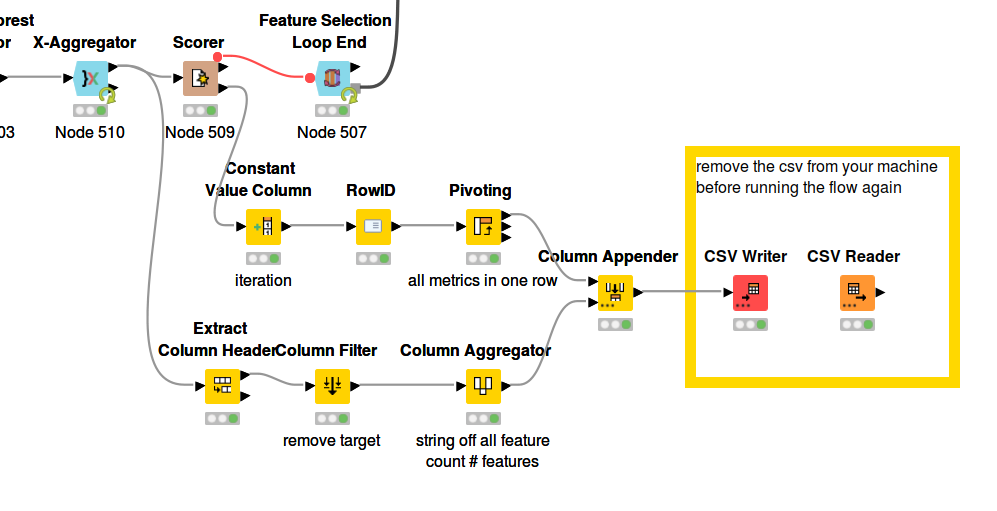
I added some nodes to your workflow DEMO_v2.knwf (195.0 KB). It generates a csv-file. For every loop it writes all the metrics from the scorer node (in one line, instead of three) and it adds the number of, and the features itselfs, involved in the loop . Hope this helps …
Dear @HansS, Your solution is exactly what I was looking for. I can’t thank you enough.
Also, I was wondering, does any of you know if there is a way to get the feature importance as well? The percentage of importance of the features used for the best model would suffice.
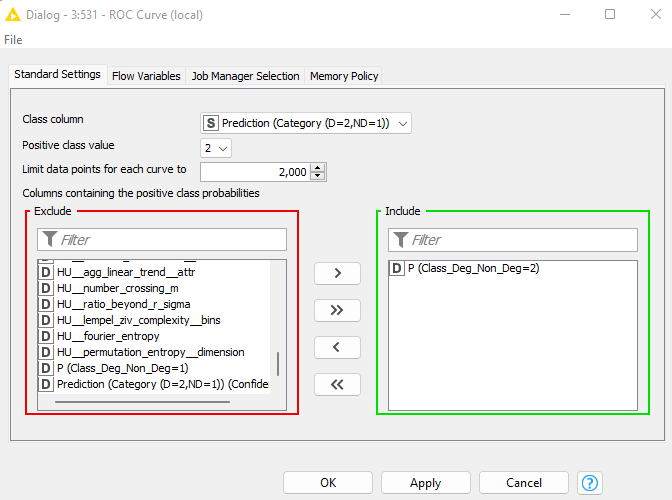
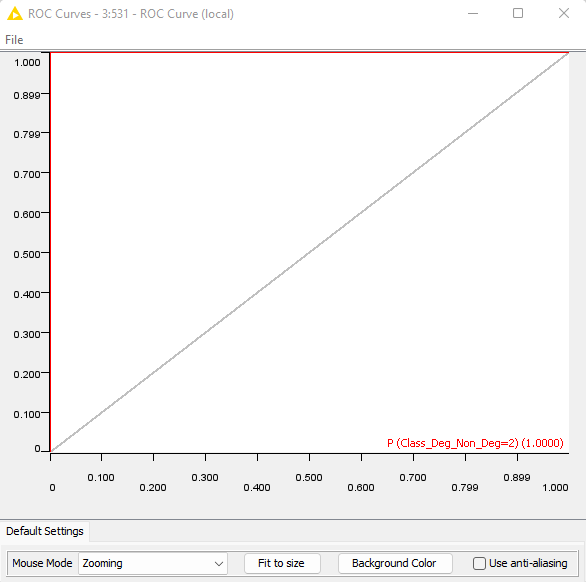
Also, I wonder what’s wrong with my ROC curve! In the ‘Random Forest Predictor’ node, I checked ‘Append individual class probabilities’. I have two classes (deg class=2, non-deg class=1). In the ‘ROC Curve’ node, I selected that my positive class value = 2. But the result looks strange.
Hi, I would like to ask another question regarding overfitting.
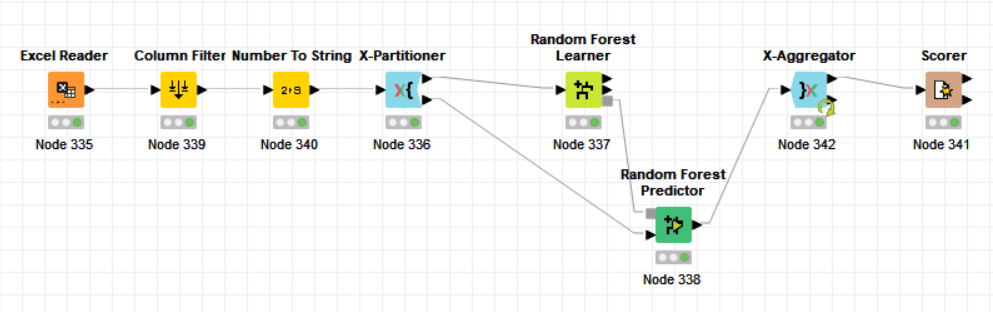
Recently I came to know about KNIME and initially used a very basic random forest classifier for binary classification. Neither any feature selection was done nor any random forest optimization was done.
The dataset is quite small (47 cases, 30 features). I did a 10-fold cross-validation with stratified sampling.
Is there a way in this workflow to understand if the model was overfitted or not?
Please find attached a screenshot of the workflow.
Normally by comparing to a test set and find whether error strongly differs.
The dataset is very small. You could maybe have a look at the errors of your 10 cv’s (Aggregator output) and see whether there is much variance.
I would also take a look at the other evaluation metrics.
Maybe some forum data scientists can help you here.
br