Hi everyone,
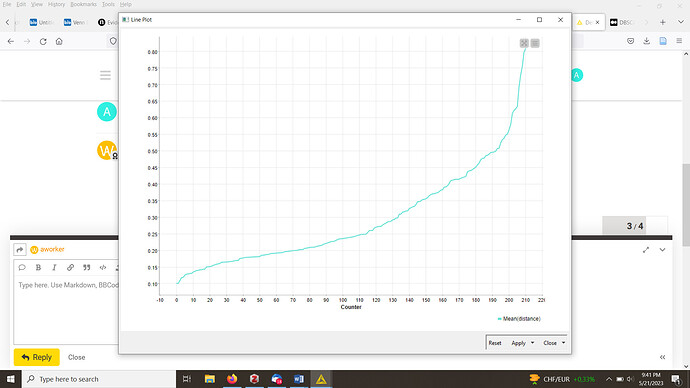
Does anyone know how to determine the maximum curvature from the line plot?
Thank you in advance ![]()
Hi @Amanda252
Could you please provide us with a bit more of information ? The best would be to upload a workflow with your data, its corresponding line plot and explanations of what you mean by maximum curvature in your case.
Thanks and looking forward ![]()
Best
Ael
Hi aworker, thank you for your answer. I am using DBSCAN node where I need to set up the epsilon value, and the way how I was trying to determine the epsilon value is from the line graph (the maximum curvature) - which would better explain why I chose a particular value. Is there other way how to do it?
Hi @Amanda252
Thanks for the clarifications. I think I understand now. Can you upload here a snapshot of the “line graph” you get please ? It will help to decide which is the best method to try to fix your epsilon. The number of samples you are trying to clusterize using DBSCAN should help too.
Thanks,
Ael
Hi @Amanda252
Thank you for the image and the number of samples in your dataset. DBSCAN is a density-based clustering algorithm as explained in this node help. 6 samples is too little number of samples to calculate a density using DBSCAN. How many columns (variables) are you considering to calculate your clustering ? What is the type of your columns ?
I this case, I would just recommend using a -Hierarchical Clustering- node or even a PCA depending on the type of your columns.
Hope it helps.
Best,
Ael
Good morning. I could have explained my dataset better. I have three columns (variable a, b, c) which I normalized using Z-score, and then I searched for the nearest neighbours, averaged them and plotted them into a line plot with increasing order. I have roughly 300 data points. Now, I want to cluster similar entries… It is the first time when I am doing something like that.
Good morning @Amanda252
Thank you for your explanations. It is clearer for me now.
The maximum curvature of a line can be obtained using the -Lag Column- node with Lag=1 and Lag Interval=1 of the distance value:
The curvature of the line at each point of the curve is the difference between the line values and its lagged values. The maximum line curvature position is the one with maximum difference.
Hope this explanation helps. Otherwise, please post here the points of your line plot in excel format and I will provide a workflow that calculates the Maximum Curvature.
Best,
Ael
Thank you so much. It works perfectly ![]()
This topic was automatically closed 7 days after the last reply. New replies are no longer allowed.
