Hello, I have a question about Line plot in KNIME 4.7.1 version.
As shown in the figure below, if you mouse over the line of the line plot, the corresponding values appear on the x-axis and y-axis.
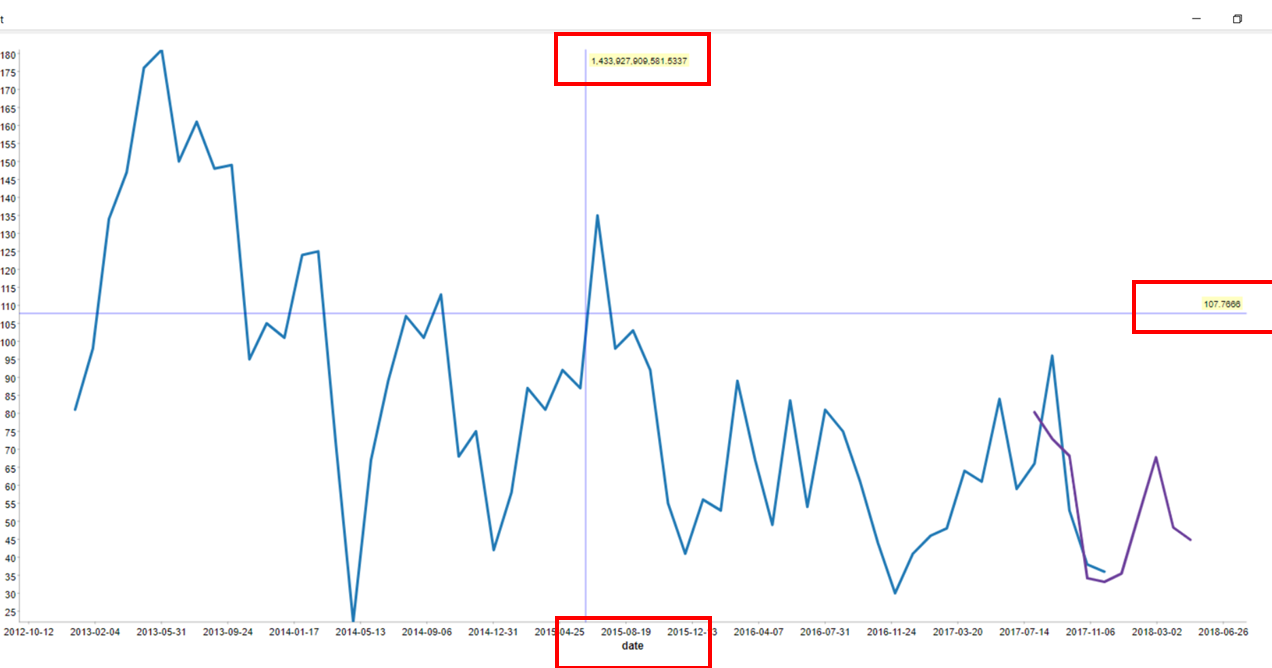
However, while the y-axis shows an appropriate value, the x-axis shows a value of coordinates other than a date value.
For non-date values, we have confirmed that the appropriate values are displayed on the x-axis, and data in date format seems to be causing problems.
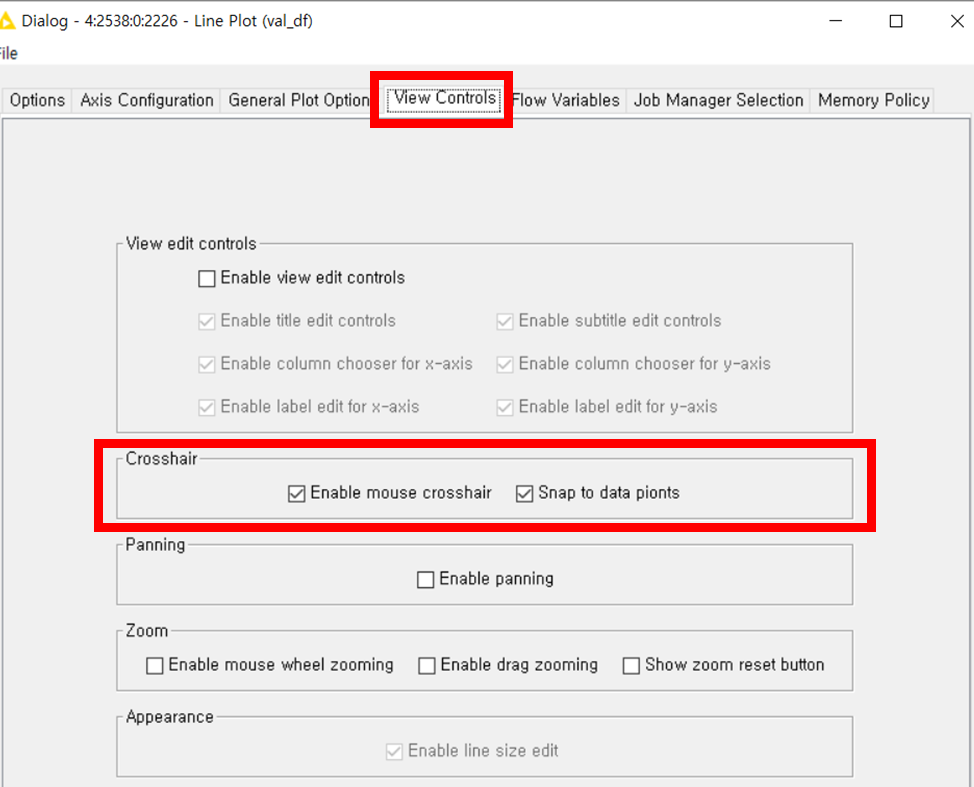
The option appears to be “Crosshair” on the “View Controls” tab, but there seems to be no change option for the x-axis value.
-
So, in case of mouse over, please let me know if there is a way to show the correct value on the x-axis.
-
Alternatively, is there a way to specify that only the y-axis values are visible?