I am working on a tidytuesday challenge. I wanted to display the data in an OSM Map View. However, it appears I was misled by the colour of it, thinking it would display within a component. If not, what I am I doing wrong and could I put some defaults to the view like CycleMap and fitting the display to the markers?
KNIME components will only show JavaScript-based visualizations in the composite views. Since it is not JavaScript-based visualizations they will not be shown in the composite view. But, you could use OSM Map to Image to create an image of that map visualization and then display that image in your composite view with Image Output Widget .
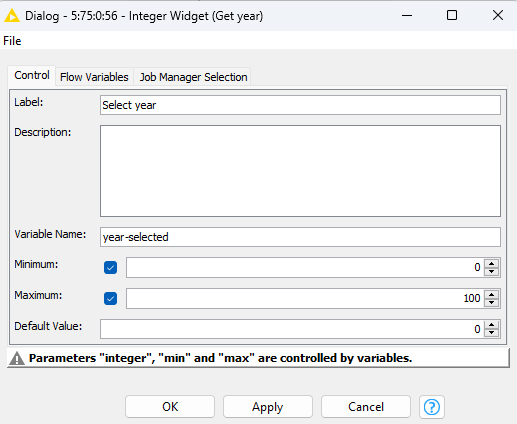
Also, I noticed you have checked the min and max values in the Integer Widget node as 0 and 100, unchecking them will allow you to control the values from flow variables.
@k10shetty1
With respect to min/max check boxes. To me, it seems, that checking/unchecking them only controls whether a limit is being applied, not which limit, and the notice about parameters controlling values says that the actual values in the fields get overwritten by the variables.
However, I am having other problems. I am not able to set a default in the Multiple Selection Widget. But more of a “concern” to me is that the markers in the image are barely visible, and I do not know how to calculate a decent zoom.
I made some changes to the component, let me know if this solves your problems. Also, check out the Geospatial Analytics Extension for KNIME extension with nodes dedicated for processing, analyzing and visualizing Geospatial data