Hola,knime forum
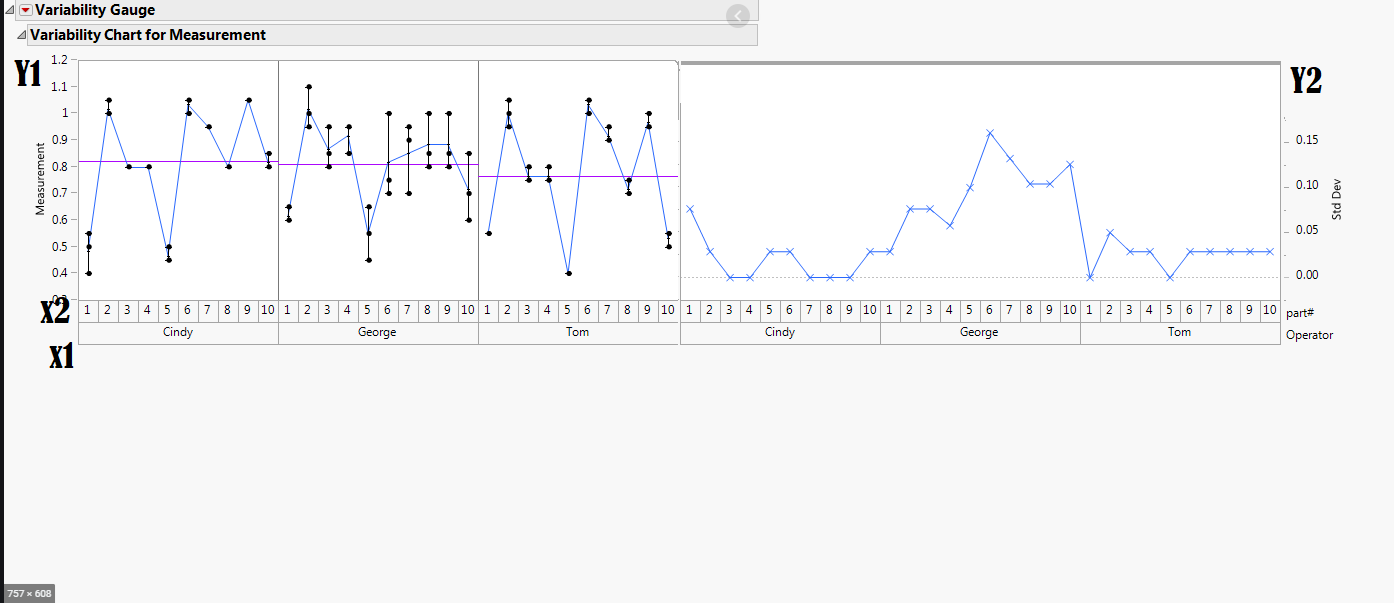
I am using R-plotly and shiny with knime. Next step I want to create plot 2x , 2y parameter like this image
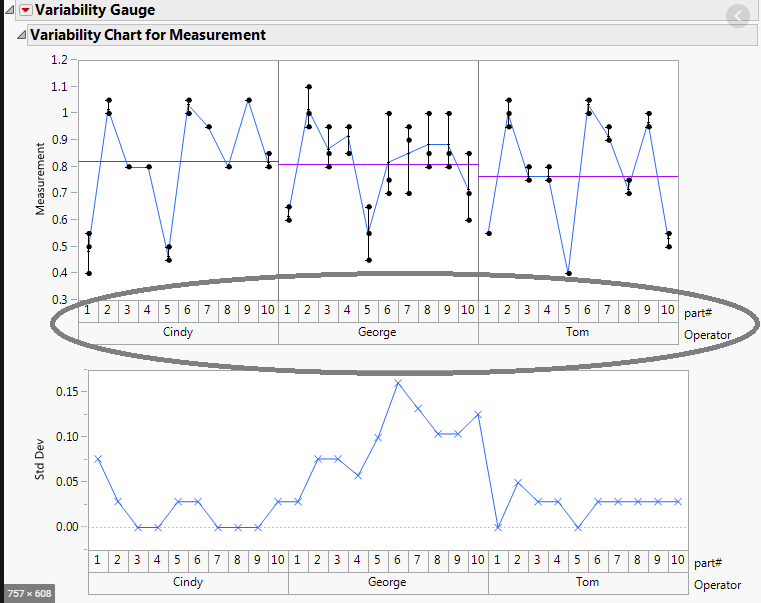
But first, I want to know how to display the name of x axis
this is my → workflow ← 2x2y_1.knwf (8.4 KB)
best regard , Supachai
Hi there @aabbaa,
isn’t this more R related than KNIME? Not saying somebody won’t help cause I know there are KNIME forum users that know R very well… Also I assume you might get better/faster help on Stack Overflow or from R community/forum.
Br, Ivan
This topic was automatically closed 90 days after the last reply. New replies are no longer allowed.