There are some operations in KNIME that are almost instantaneous even when applied on large tables, while others sometimes take minutes to complete. For example, applying a Row Filter on a 10-Gigabyte sized table takes a long time, while applying a Column Filter on the same table happens in the blink of an eye. The reason for this is that the Row Filter analyzes the whole table and makes a full copy of it, while the Column Filter simply generates a new reference to the old table (at least, that is what I think).
Experienced KNIME users know this. Some (like myself) found out the hard way; my first workflows were extremely inefficient because I did not know this as a beginning KNIME user.
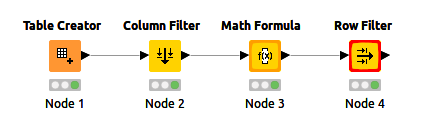
Hence my suggestion: clearly mark nodes as “cheap” and “expensive” in the KNIME documentation. One could even consider changing the KNIME workflow canvas UI so that expensive operations are clearly recognizable:
Here the redness of the borders would indicate how “expensive” an operation is. On one of my data tables the Row Filter takes 65 seconds, the Math Formula 44 seconds, the Column Filter 0.004 seconds.
The other thing to remember is that if the table is in a database it is much more efficient to have the database do the filtering with DB Row Filter and / or DB Column Filter, which does the filtering in the database server, and then only the smaller result set is returned to the KNIME AP.
Or just use the db query reader and write a proper SQL which is much faster than putting it together visually especially if you also need analytics functions and such.
I like the coloring option but it should include the number of rows and a user configurable gradient. A row filter in a table with say 1000 rows will still be more or less instant. So the coloring should depend on user configuration (eg at what point do I think it is getting slow? this is different for each user) and the size of the table (size=rows and/or columns). For example machine learning training can get very slow with a lot of columns even if there aren’t that many rows.
Therefore I think this is not so trivial to get right but of course would be very helpful especially for new users.
I know next to nothing about the KNIME internals, but from the way KNIME behaves, I can think of 5 types of nodes… In order of “expensiveness”:
Nodes that extract/manipulate the table properties / column headers / types (e.g. Column Filter)
Nodes that scan all the rows (Statistics node)
Nodes that scan all the rows and add/change certain columns (Math Formula node)
Nodes that scan all the rows and generate a full new copy of the table (Row Filter, depending on its config)
Nodes that send the whole table outside of the Java environment (R script nodes, Javascript plotting nodes)
These “classes” could be assigned to each node in the documentation just below the node title or somehow in the node representation on the canvas (my suggestion was border color, but I am not a UI expert).
I think that classification is the right level of detail. For some nodes the performance depends on the settings or even the data structure. Since this feature would be for newish users, considering all cases would only overwhelm them.