Hello
For my question about how to draw a graph, one of my friends had a guide as follows, which I think is very attractive and practical, and I really need it:
Advice provided by DanielBog-KNIME Team Member:
(Maybe as another approach, we recently released our new Generic ECharts node with 5.2. This node comes with an AI functionality to help you create your custom plots. It might not give you 100% what you need, but maybe give you a great starting point. See the attached video for an example I created for your given dataset).
You can also have a look at the ECharts example gallery 3 and check if they already provide an example for your problem.)
Can someone explain me how to use echart in knime?
Or how does it work outside of knime? How to enter information to draw a graph?
Hi @alex1368,
In the node repository, search for the Generic ECharts View node.
In the node dialog, you can simply add an option object to have your desired plot. Please take a look at the examples provided in the node or at Examples - Apache ECharts
Also, you can visit Get Started - Handbook - Apache ECharts to get started with Apache ECharts.
If it’s still challenging for you, you can also ask K-AI. Connect your data table to the node then explain your desired plot to K-AI and it will provide you with the code.
2 Likes
سلام استاد قاسمی من از دانشجوهای شما هستم و خیلی خوشحالم که جوابم رو شما دادید
من به شما یک ایمیل فرستادم اگر صلاح بدونید به من جواب بدید
Happy to help. I haven’t received anything. What is it about? If you want to share a workflow or data, I would recommend not to share any confidential files. You can provide us with a sample dataset and explain what exactly you want as output, then the community will be happy to help.
1 Like
Thank you Master for your guidance
I sent your email to your email.
Anyway I am so glad to answer
sample.xlsx (11.9 KB)
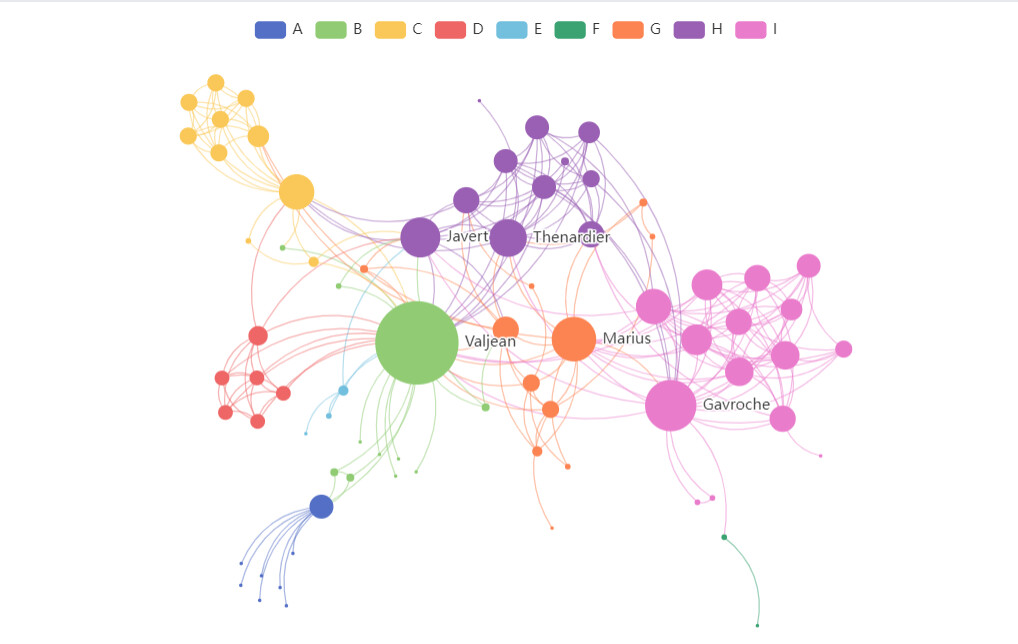
I have a sample file as follows and I want to have a graph output as follows Want to be large and small on the basis of the frequency of each ninety size