Hi
Is it possible to create dynamic maps (heat/geographic), showing spots in the course of time? Sort of a GIF video.
Kind regards
Thiemo
Hi
Is it possible to create dynamic maps (heat/geographic), showing spots in the course of time? Sort of a GIF video.
Kind regards
Thiemo
E.g. I tried the spacial heat map node,
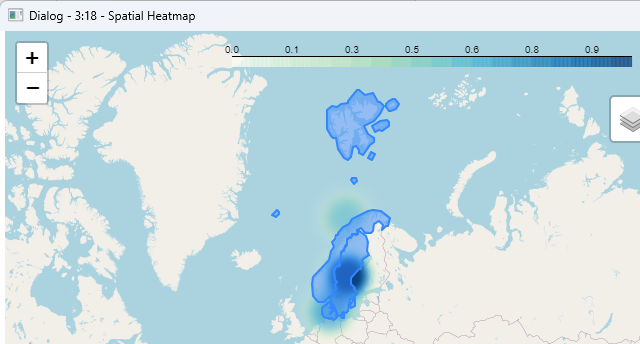
where I encounter two shortcomings.
I think that with that node, there is no help, but is there one I did not see that does not normalise, that does recolour the boundaries (outline and content) instead of placing a blob in some fancy not always associable to the country (Polynesia maybe)?
I can find my try in my hub.
Cheers
Hi @Thiemo.Kellner,
Have you tried using the Kepler.gl Geoview node? This view is highly interactive and allows you to change various aspects of the view within the visualization itself.
Best,
Keerthan
This topic was automatically closed 90 days after the last reply. New replies are no longer allowed.