Fellow Knimers, I have two questions in regards to the title of this post.
Question 1
I have found quite a few sources to deploy Python for programmatic creation and display of trading stocks’ support and resistance lines. Here are two sources I deemed reliable:
i. Source 1 using k-means
ii. Source 2 using a method I don’t understand but the images look promising still
I am hoping that I can deploy the codes in Knime without Conda, using only the bundled extension available in Knime. I hope someone can help point out if this is possible with either of the two sources.
Question 2
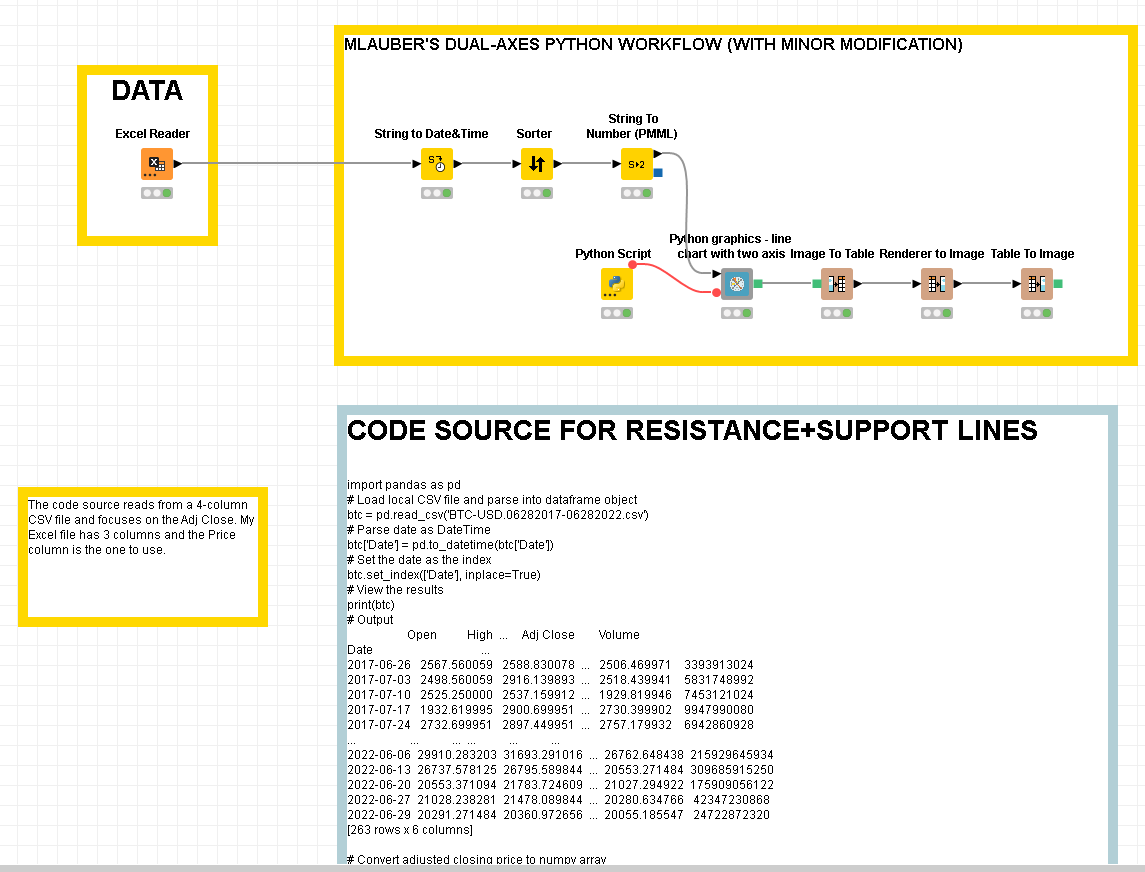
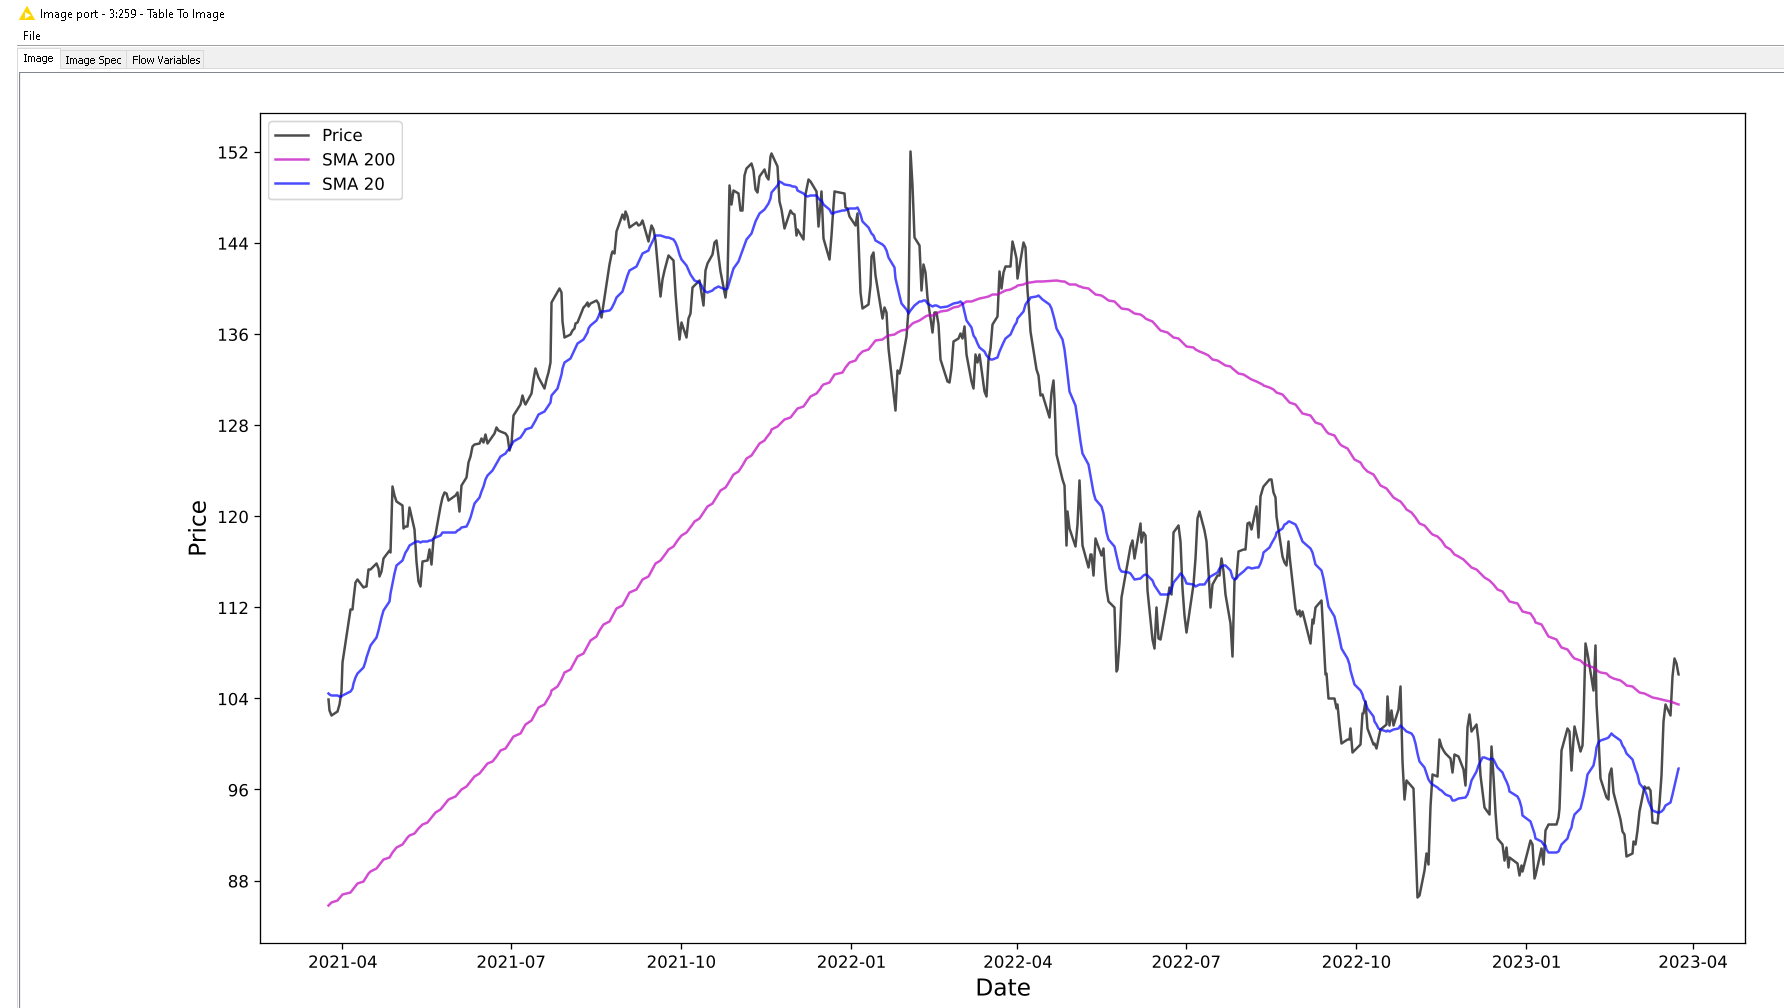
The second question is specific to @mlauber71 who generously helped me out in a previous related post, and this time I’m asking if your YFinance Query workflow here can be modified to be able to use with Knime’s bundled python integration extension And if this is possible (hopefully), can it be integrated into the code you provided in the previous post where the dual axes graph was created using Python?
Relevant Notes
The only reason I’m using Python is because of the existence of the integration extension by Knime. It lowers the barrier for non-coders like me to not have to configure the environmental setup.
Install the Scikit-Learn package: pip install scikit-learn
Install the Pandas library: pip install pandas
Install the plotly library: pip install plotly
Download the historical data from Github courtesy of Yahoo Finance.
And these three packages are installed in the bundled environment (see above).
As @mlauber71 s YFinance Query workflow: It seems to have some pip dependency on yahooquery (see the infobox in his workflow). The bundled environment does not have that.
Hi @steffen_KNIME , I’ve been reading posts on the forum to learn more about using Knime’s python scripts. What I gathered is that even though I have a custom script at hand, I would still need to know how to amend the output and input sections of the data inside the custom code. If it’s not of a big burden to you, would you be kind enough to amend the custom code so that I can use it straight away (in other words, I can produce results in the output port without errors)?
Edit:
And I just realized that, the graph shown in the reference link isn’t the one I wanted, and I would need to use the graph produced by @mlauber71 in the other post. That makes things even harder for me if I were to figure out everything on my own, given my non-coding background.
The workflow is in an executed state, but if for some reason you didn’t receive the data, here’s the Excel file containing the data: forum data hybrid graph.xlsx (160.5 KB)