Estimating the total number of active users in a vast population can be done through a statistical analysis process. some of the method can be seen in the below, How its possible to run and estimate by KNIME? is there any specific node for such this kind of estimation?
Target: Estimate the total number of the valid users in a vast population like 100M Users which has counting by Id numbers. first is id is 0 and last id is 100M.
Dear @mlauber71 Thanks for you answer, I am wondering if it can be done by any node in KNIME, I try to do it by KNN while it seems the KNN node cannot use for estimation method, So the best node to for this purpose is Python or as you mention Maybe R.
In the case of any estimation use case, how can KNIME be used to accomplish it?
@natanzi maybe you could explain a little bit more what this data is an what an expected result would be. Also you might check if you are 100% comfortable with sharing this data in a public forum.
KNIME has several nodes for sub-sampling data. Not as many as on your list, though the algorithms could be implemented using several of the available nodes.
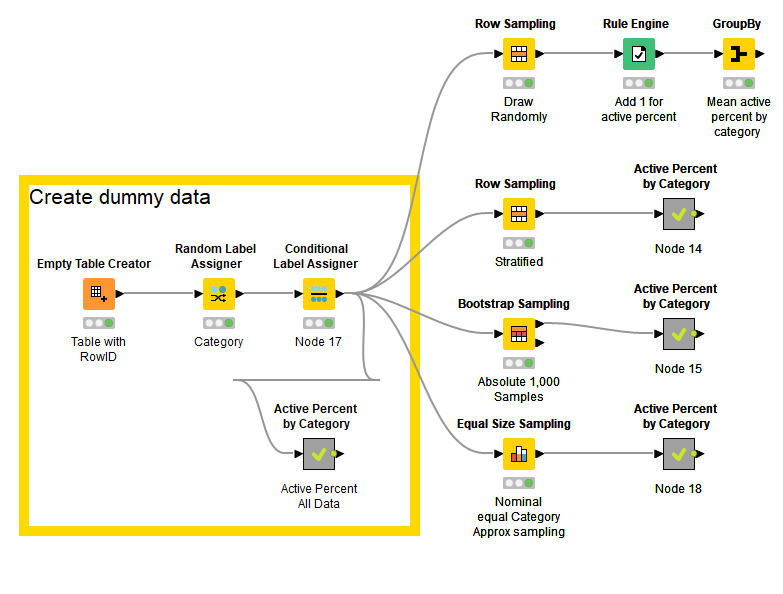
The following example shows:
Random sampling (using the Row Sampling node)
Stratified sampling (using the Row Sampling node)
Bootstrap sampling (using the Bootstrap Sampling node)
Equal Size sampling (using the Equal Size Sampling node)
Creates an empty table with 30,000 rows. The rowID is the ID of the record.
Randomly assigns one of three category labels to the rows: car (50%), Train (30%), Hovercraft (20%).
Sets users (rows) active/inactive such that the following percentage of users are active per category: Train (1%), Car (10%), Hovercraft (20%).
This should mirror your actual data set which will be significantly larger.
Then apply the sampling approaches listed above to the data.
Then calculate the percentage of users in each category that are active (the metanodes contain the two component shown in the first row). Rule Engine to set the va
Dear DiaAzul,
Greetings, Thanks I’m trying to verify the active users count on any social media by sampling, for example on GitHub, I’ve fetched 5000 random ids and I’m trying to create id spaces for myself, and then I’m trying to estimate the active users using Random Subset Sampling. I know I should bring more sample to have more accurate estimation. it seems the bootstrap sampling also have same result.
I’m not sure I understand exactly what you are trying to do. From what you have written it sounds like you are sampling the population of users on social media by selecting a random subset of users (5,000 out of a potential 100 million for example).
Where I get lost is when you talk about estimating the active users using Random Subset Sampling and Bootstrap Sampling. I would have expected a description of the process that you use to determine whether a users is active or not, then having this measure you can calculate additional statistics such as the mean number of active users in the sample. You might then use bootstrap sampling to calculate confidence intervals.
All of the above is possible in KNIME, the only aspect which is not clear is how you determine whether an account is active. For github that could be a commit within the last 4 weeks (as an example); though in that specific case you are not going to see any private activity, so many accounts might look inactive in public whilst they are privately very active.
You might want to work through your methodology and clarify what you are trying to achieve at each step. This will make it easier for others to identify KNIME approaches to solve your problem.
Dear @DiaAzul
Thank you very much, you right, My assumption is that if we can fetch data from GitHub, the user is active, but this may not be the case, because as you mentioned, some users may not be active or might just be in private mode. We can call this “churning users”. but the number of user-ids generated starts with 1 and increases by 1 for each new user created. In any event, if some users delete their accounts, their ids will be removed from the id space and will not be available to new users. So with this case I use the the Random Subset Sampling method.
I wrote code in python and test it. it seems is fine, I would like to make specific node for Random Subset Sampling
import pandas as pd
import numpy as np
import matplotlib.pyplot as plt

# Properly formatted file path
file_path = r'sample_user_data.csv'

# Read the csv file
df = pd.read_csv(file_path)

# Access the id column
id_col = df['id']

# Define the number of sampled subsets (m) and the subset size (l)
m = 100
l = 100000

# Divide the space into N_L spaces where N_L = S/l
# S is the last id which has been generated by a registered user
S = 125318092
N_L = S // l

# Figure out which samples to take
sample_buckets = np.random.choice(np.arange(1, N_L + 1), m, replace=False)

# Define an array for X[i] (think of it as X^L_i) where i, in this case, is m (we randomly pick m buckets)
X = np.zeros((m,), dtype=int)

# Sample
for i, bucket_id in enumerate(sample_buckets):
    # Get the subset of data that belongs to the current bucket
    subset = df[(df['id'] >= l*(bucket_id - 1)) & (df['id'] < l*bucket_id)]
    X[i] = len(subset)

# Calculate the estimate
estimate = np.sum(X) // (m * (1/N_L))
print('Estimated population size:', estimate)

# Plot the histogram of X
plt.hist(X, bins=100)
plt.xlabel('Bucket size')
plt.ylabel('Frequency')
plt.title('Size of population')
plt.show()

# Calculate the validation set
validation_set_size = 15
validation_buckets = np.random.choice(np.setdiff1d(np.arange(1, N_L + 1), sample_buckets), validation_set_size, replace=False)
validation_X = np.zeros((validation_set_size,), dtype=int)

# Sample validation set
for i, bucket_id in enumerate(validation_buckets):
    # Get the subset of data that belongs to the current bucket
    subset = df[(df['id'] >= l*(bucket_id - 1)) & (df['id'] < l*bucket_id)]
    validation_X[i] = len(subset)

# Calculate the estimate for the validation set
validation_estimate = np.sum(validation_X) // (validation_set_size * (1/N_L))
print('Estimated population size for validation set:', validation_estimate)

# Plot boxplot of X and validation_X
data = [X, validation_X]
fig, ax = plt.subplots()
ax.boxplot(data)
plt.xticks([1, 2], ['Results from the entire id space', 'Results from a validation set'])
plt.ylabel('Bucket size')
plt.title('Size of population')
plt.show()