Train a classification model using the Decision Tree algorithm. Evaluate the accuracy of the class prediction by scoring metrics, ROC Curve, and Lift Chart.
Great job @Maarit !
Finally we have a simple brand new workflow showing how to score classification models!
I love the fact that now you can open an interactive node with the new Scorer (JavaScript) node !
Thanks @paolotamag! Yes - those interactive views are nice on their own like this, but even more powerful when combined with other views in components. I am currently working on more of these examples, and they will all be shared here via the Workflow Hub!
Related to this topic of evaluating model performance.
Feature request: Scorer JavaScript
testing classification models (different types or just different features etc) to see which perform the best on the data you have
would like to be able to connect multiple Predictors into the Scorer… and the Scorer retains the input table name or Node name… that way the Lift and ROC curve can be plotted on one graph so you can see performance across models
I think there might be some language confusion going on here, as I’m not really sure what you mean by the question.
There are two scorer nodes you can use for classification problems: the Scorer and the Scorer (JavaScript). They both operate in the same way, by comparing to the true label to the predicted label of the model. Both labels are assumed to be included in the same dataset as generated by the upstream predictor node.
Is your question about comparing the results of different models, each with their own predictor? In that case you can get the scoring metrics for each model, and combine them into a single table for comparison.
But neither case requires a scorer node with multiple inputs.
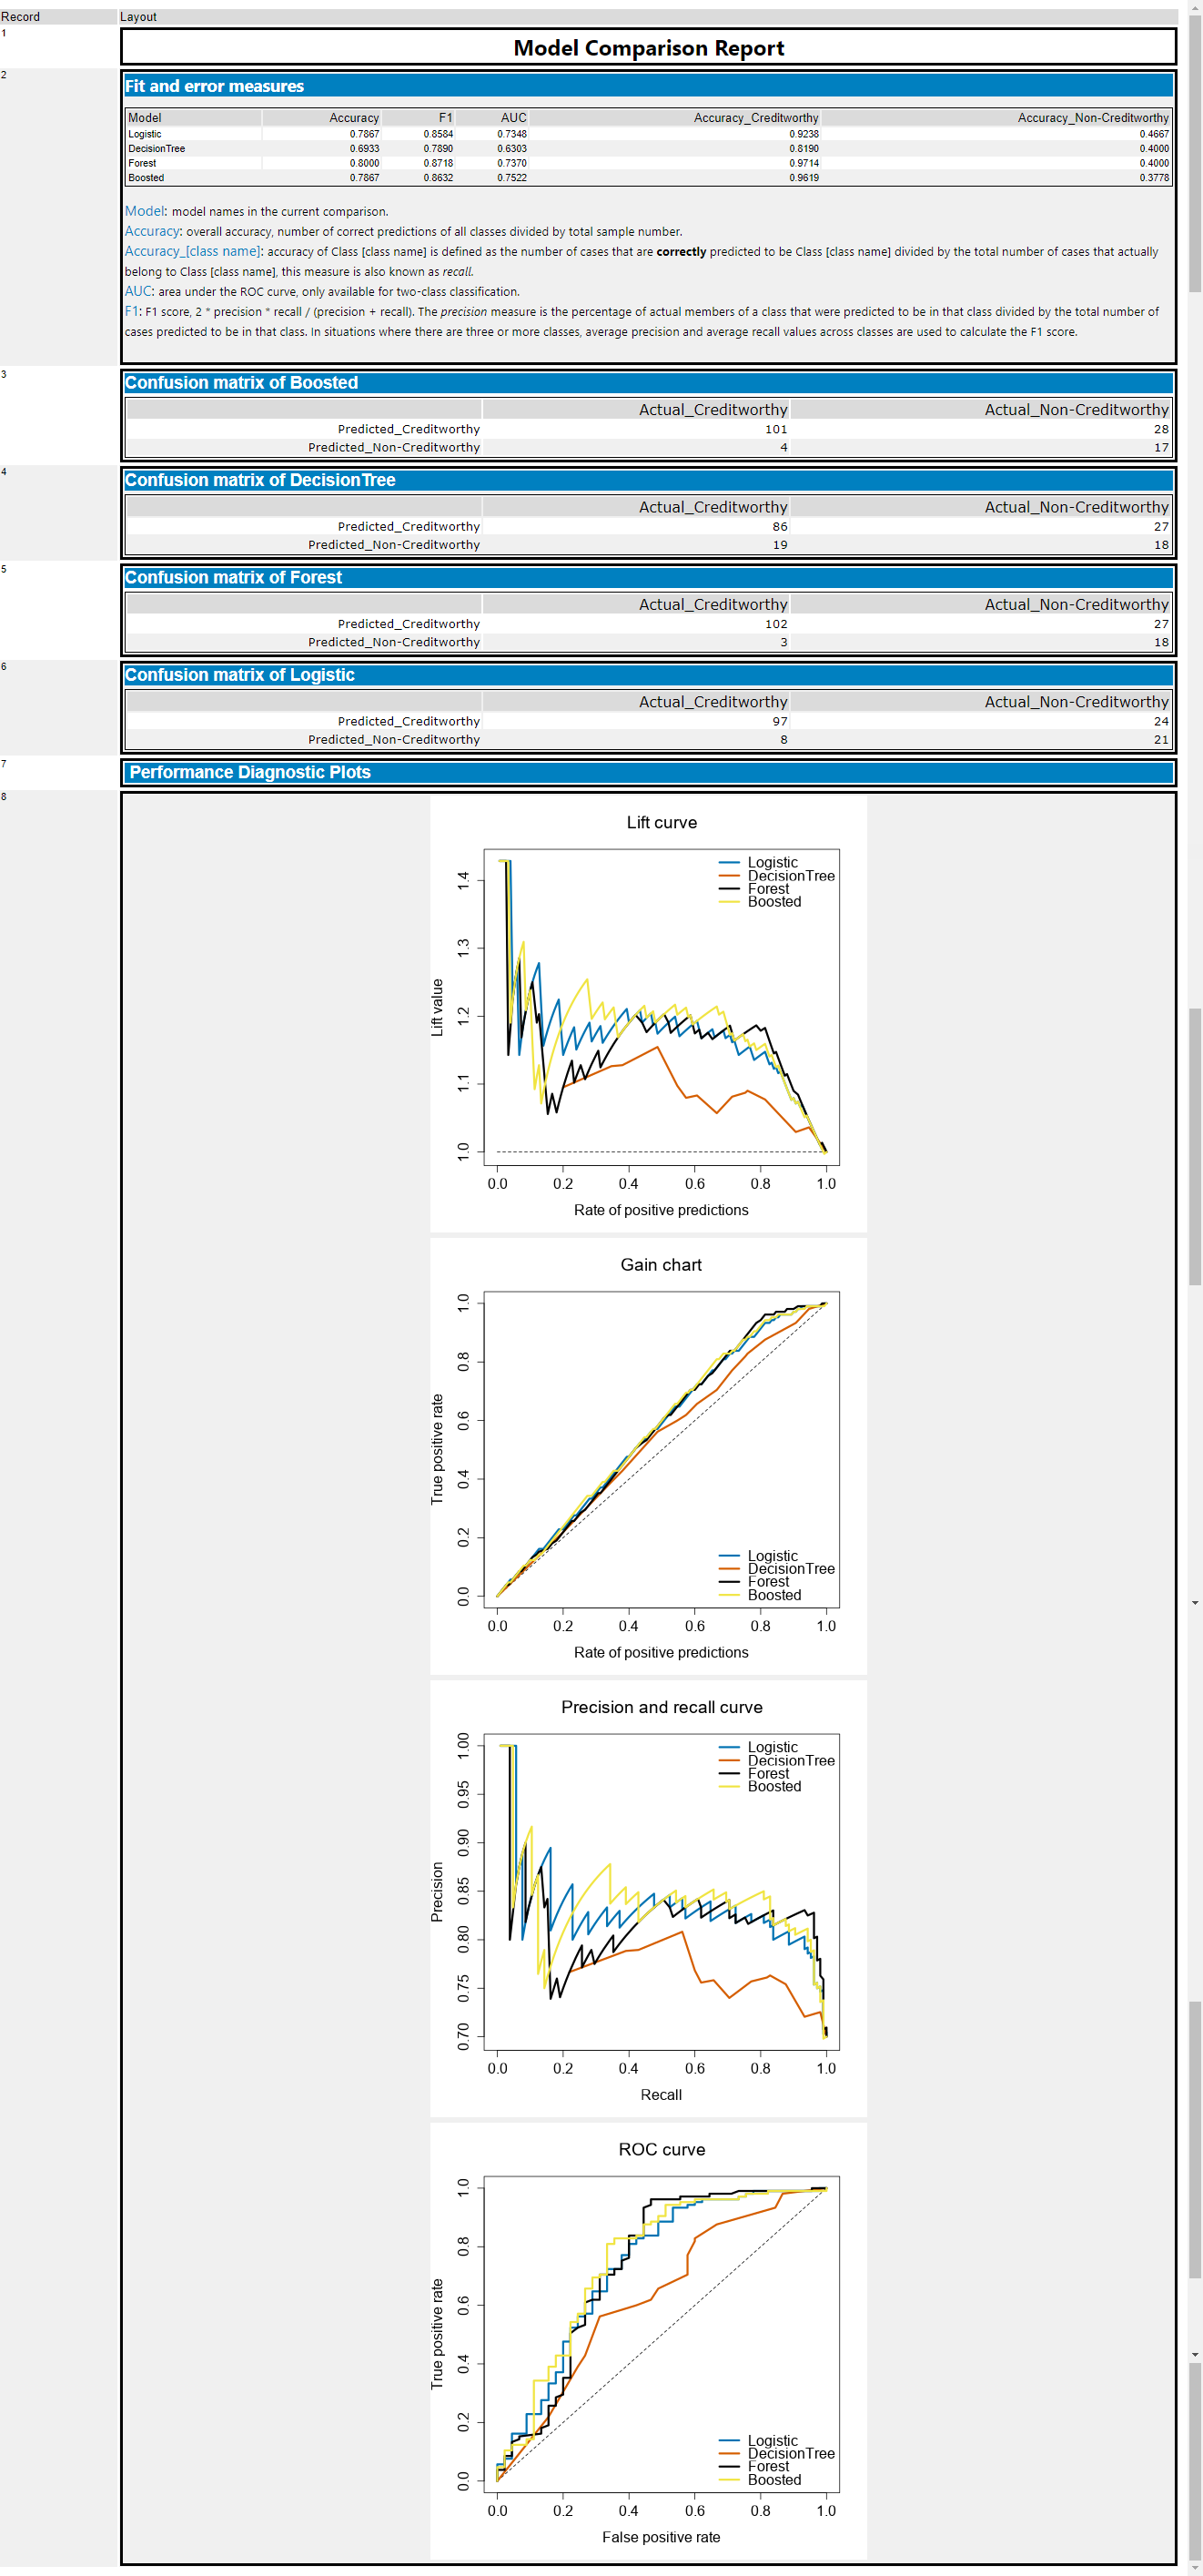
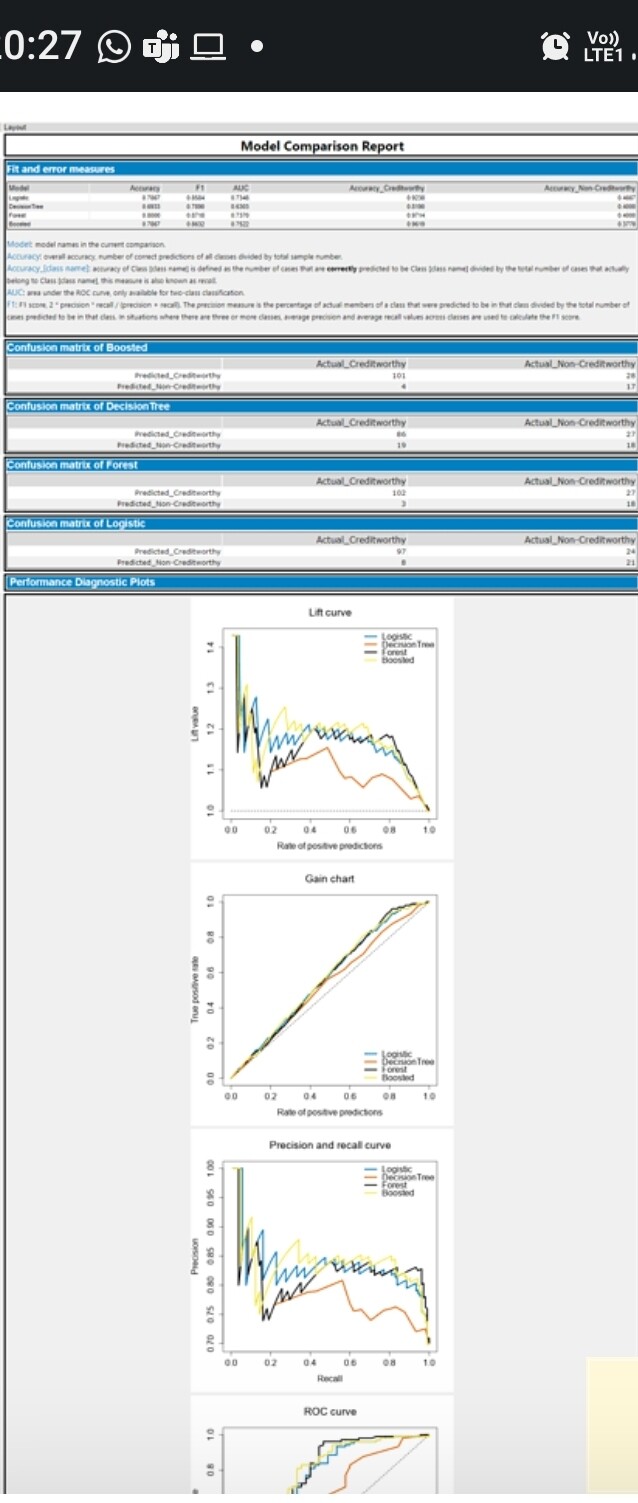
That report is from a software package other than KNIME, I’m not sure what exactly. I believe @DemandEngineer was using it as an example of the kind of thing he’d like to produce.