Extra simple workflow to color header row backgrounds in Excel file

Hello All,

I would like to just input (e.g., read) an xls file, set the background of headers to a given color (e.g., yellow) and output the colored file. I had a look at “Continental Nodes for KNIME — XLS Formatter Nodes” which feels like killing a fly with a sledge-hammer (plus, I confess to beeing too lazy to learn all that for such a simple result). Is there a real simple way to achieve that?

Thanks!

@Nazaire well there always is the Python package OpenPyxl where you could do a lot of manipulations, including colouring. This only involves a few lines of code.

4 Likes

Hi @Nazaire

You could try the component included in the following workflow downloadable from the HUB:

It does the job automatically without asking what color or formatting you want. However, once you have copied, pasted and run it in your own workflow, you might customize it. All the continental nodes in the component are commented so that you can know which one to customize based on your choices.

Hope it helps.

Best,
Ael

3 Likes

Hi @Nazaire,

The Contintental Nodes are great but there is an initial learning curve which I agree with you makes them appear “overkill” when all you want is to format the headings.

This is exactly where I found myself, and so I created the following component, to take away the complexity in handling the simple use case.

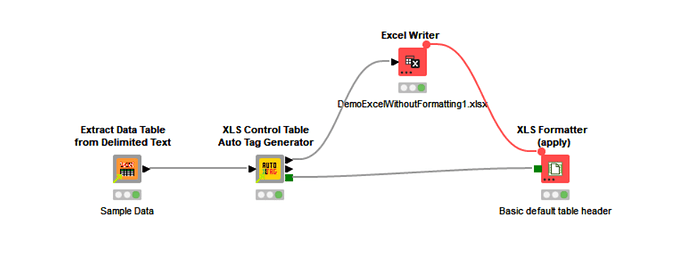
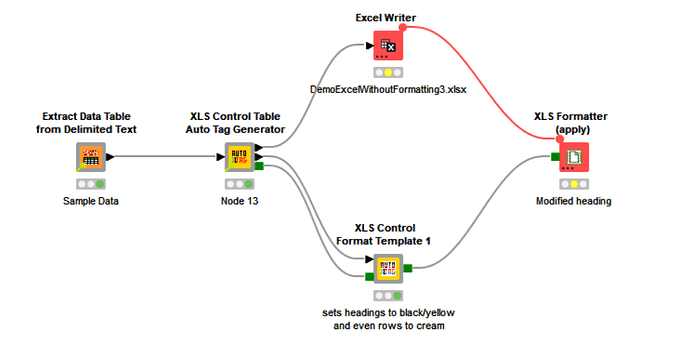
How about this for a “simple” workflow:

There is practically zero configuration here other than specifying the Sheet Name on the “Auto Tag Generator” and the sheet names in the Excel Writer/Formatter nodes
image

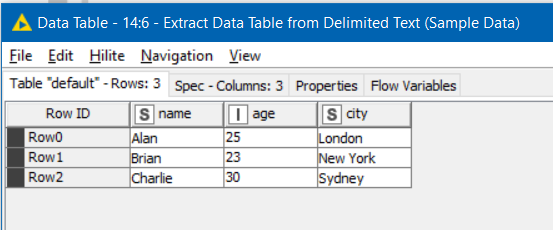
Input data:
image

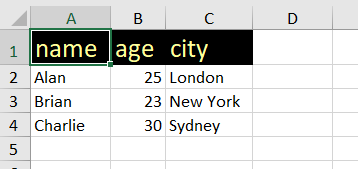
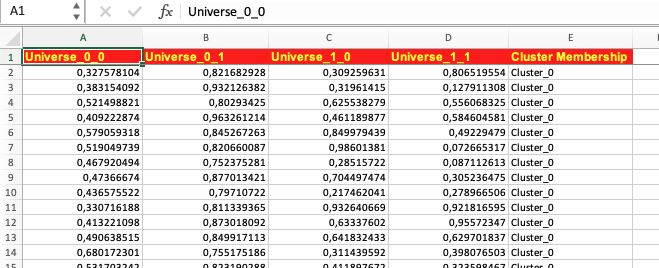
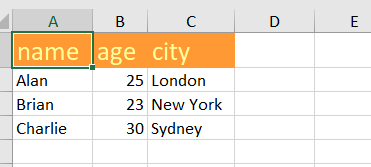
Excel result:

image

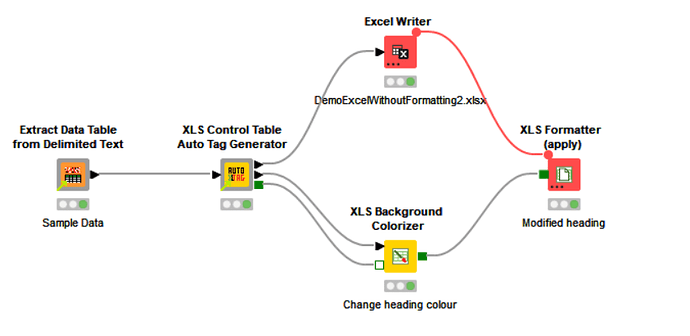
Should you choose to, you can link in the additional continental nodes to change the settings, because the component produces a control table for the Continental nodes on its second output port if you want to go further and make use of them…

e.g.

image

This is the component.

You will still need to add the Continental Nodes extension to your environment, but you won’t have to learn too much about creating tags. Please take a look at the help on my component for the set of tags it creates on your behalf, and let me know if any queries.

Simple Excel Formatting.knwf (410.0 KB)

(edit: looks like this is a common requirement :wink: )

further edit:
Nearly forgot… I have an additional component that can be copied, disconnected from the hub and modified (then saved locally as your own “template” component under a new name)/

You can find this here:

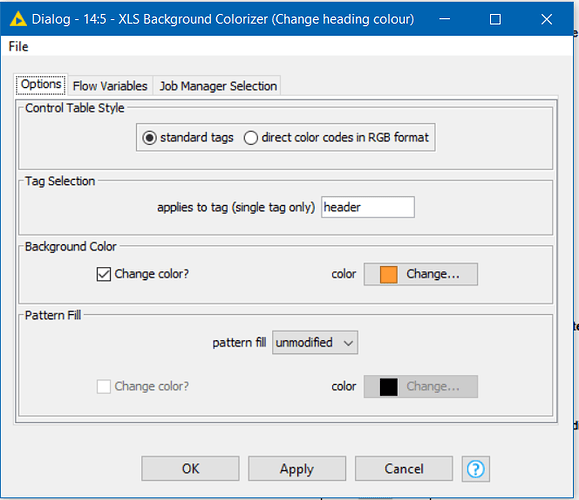
If you disconnect it from the hub, and open the component you will see it has a number of Continental nodes called within it. Change these to the settings you want then share the template component as a meaningful name, and you can apply “standard settings” in future workflows by including that template component.

Just change the config for each of nodes in the red box to match the output format you require, or add in further continental nodes:

(I’ve updated uploaded workflow updated to include this additional “template” component)

6 Likes

In reviewing this post, I just noticed a non-critical error in the control table output shown, but my 30 minute window to edit the post had lapsed.

Only the first three columns of the control table are valid. The other three would be ignored. (missing config on a joiner!). I’ve updated the component. Thought I’d mention this in case anybody was confused by the XLS Control Table having six columns even though the sample data had just three! :wink:

The generated control table for the example looks like this:

While I’m here, I’ll quickly demonstrate what this table means. It is basically the set of tag names that will be passed to the Continental formatting nodes. Tags are delimited by commas, and each cell represents a cell on the data table. So the tags contained in a cell all apply to the corresponding data cell.

So in this example you could use the header tag to change formatting for all column headings, or just the h:name tag to change formatting of just the “name” column heading.

Likewise you could use the d:age tag to change formatting of just the data rows for the “age” column, or the “data” tag to change formatting of all data rows.

You could use the t:Number (integer) tag to change the format of all Integers, or the band:odd tag to change formatting of all odd-numbered data bands. The first data-band being considered “even” because in Excel it is on row 2!

There will of course be times when the auto tag generator doesn’t output a tag for what you want, but it tries to cover most of the simple stuff. Hope that helps! :slight_smile:

3 Likes

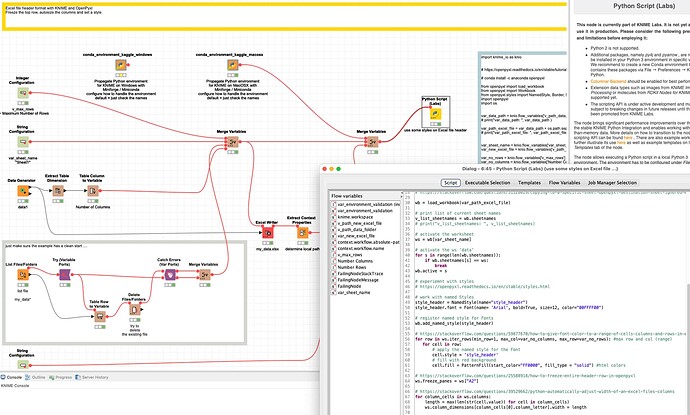
@Nazaire I built a slightly different example of the use of OpenPyxl with some configuration. It would determine the number of columns and then set a pre-defined style, auto-size the columns and freeze the top row.

The same principles could be applied to other formats. So if you like coding you could do it with OpenPyxl :slight_smile:

image

kn_example_python_excel_format_header.knwf (130.1 KB)

4 Likes

Would you consider to color the excel output “template” first and write into the colored template. Then you can skip using continental nodes
br

1 Like

This topic was automatically closed 90 days after the last reply. New replies are no longer allowed.