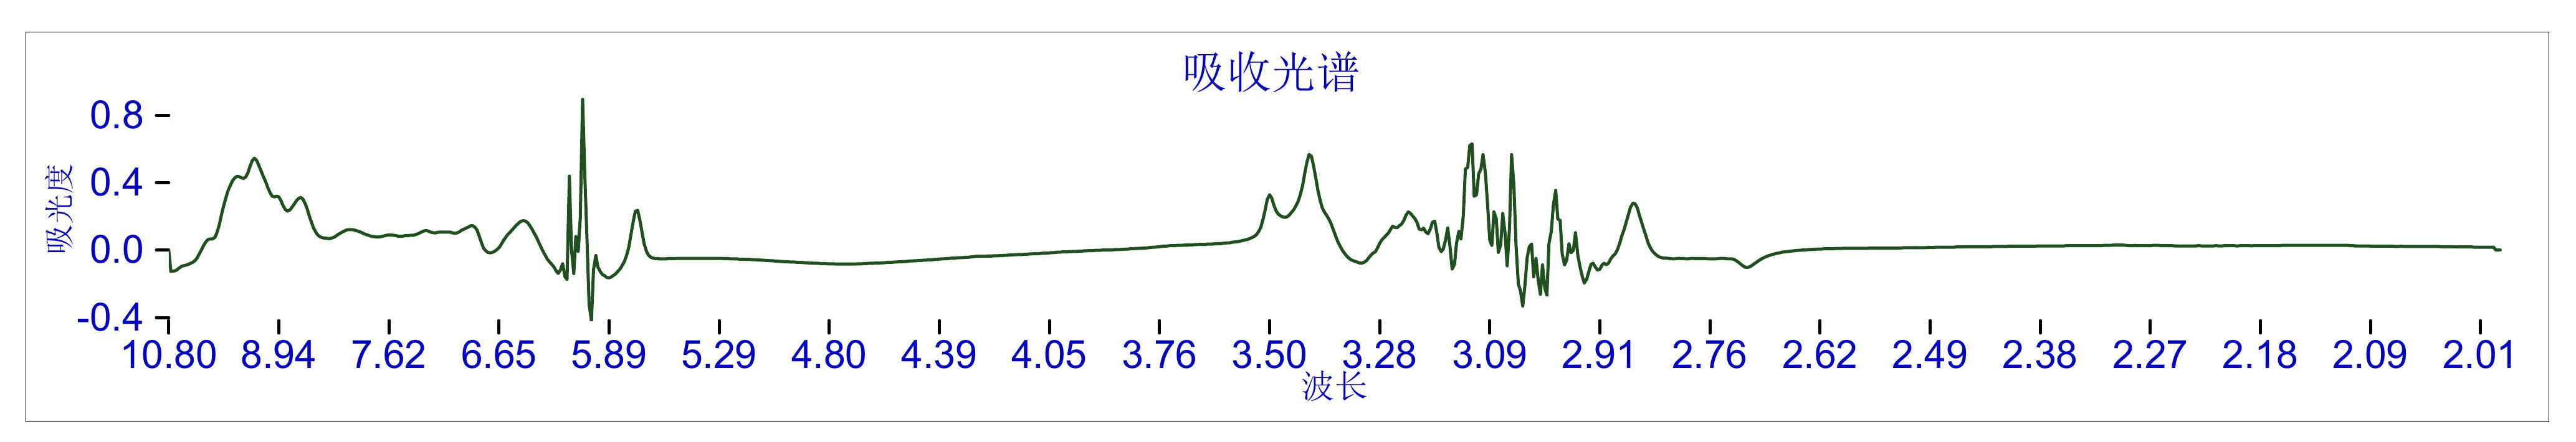
Hello, I have images of charts (actually IR spectra). The labels are wavelengths in the x-axis and absorbance in the y-axis. The spectra themselves are in a dark green color and the axis labels and tick marks are in blue. Is there a way to get the pixel positions for the spectra (dark green colored), in the form of a x, y table? Also, would be possible to perform OCR to report the numerical values of the tick marks? I am uploading an example spectrum for reference.
Many thanks for your kind help.
Cheers,
Bernard