First things first, I’m a very bloody beginner at Knime, so I apologize if my question is trivial to most of you.
I’m a student and i have this assignment where I have to take scans of breast cancer and identify the cancer cells through clustering.
I know the first steps i have to take are to:
read the image
greyscale it
turn it into a csv file with the columns being x and y coordinates of the pixels and a numerical value for their color
This way i could visualize the pixel values in a scatter plot that will look like the respective image and then try to analyse it through clustering
The problem is, I don’t know what nodes to use or what kind of extensions i would need for this. Any help in the listed steps as well as ideas for the assignment in general would be greatly appreciated.
thank you very much for your input, this really helps.
Is there a way to turn the ouput table into another table which has 3 columns:
x-coordinate of the pixel, y-coordinate of the pixel, greyscale (1-256) value of the pixel.
I’ve been looking for a suitable node that can show me the coordinates of a table cell but couldn’t find one for the life of me.
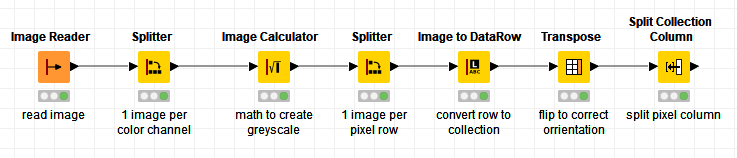
There’d be some cleaning up to do but using the unpivoting node with a configuration like this would build the kind of table you’re looking for, just apply it to the end of the above example.
So it WAS the Unpivoting node, I just didn’t choose the right settings, god damnit. Again thank you so much. Now to find out how I rename columns and rows.
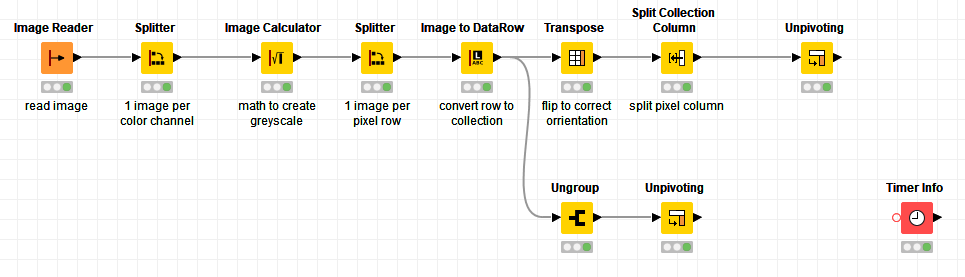
In this case, you won’t necessarily need to transpose your table, so you can gain some performance (in particular for larger and more images) by using the Ungroup node (instead of Transpose and Split Collection Column), as illustrated by the lower branch in this workflow screenshot: