Extrakt two variables from .txt files in a folder and combine with a third variable (time) given in the file name

I have recorded spectral data (wavelenght, intensity) as .txt files (see below). In the name of the text files is a time stamp (e. g. USB4J009161__0__14-39-30-858.txt, USB4J009161__1__14-39-30-969.txt) . I want to display the respective spectral data in the txt-files (several thousands) as a function of time. Can anybody help me here?
Many thanks and best regards
Jürgen
Data from USB4J009161__0__14-39-30-858.txt Node

Date: Wed Mar 18 14:39:30 CET 2020
User:
Spectrometer: USB4J00916
Trigger mode: 0
Integration Time (sec): 1,000000E-1
Scans to average: 1
Electric dark correction enabled: true
Nonlinearity correction enabled: false
Boxcar width: 0
XAxis mode: Wavelengths
Number of Pixels in Spectrum: 3648

Begin Spectral Data<<<<<
195,589 -415,57
195,809 -415,57
196,029 -415,57
196,249 51,37
196,469 -59,22
196,689 51,37
196,909 -28,5
197,129 -24,4
197,349 26,79
197,569 121
197,789 61,61
198,009 53,42
198,229 65,71
198,449 -14,17
198,669 -28,5
198,889 -282,45
199,109 -1,88
199,328 -42,84
199,548 -61,27
199,768 -12,12
199,988 51,37
200,208 -3,93

Hi @JGWZG,

I have some ideas, but I think I’d need some clarification first to see if they’ll actually work.

I want to display the respective spectral data in the txt-files (several thousands) as a function of time.

It’s unclear to me what this would look like. Do you have an example of your desired output?

Other things that would help include:

  • uploading an example text file as a text file
  • uploading a workflow that you’ve started, if possible
2 Likes

Hi @JGWZG -

Would a looping mechanism help here, to read your files sequentially and append them to a single table? You could then use that table to generate a line plot. Maybe something like this?

3 Likes

It sounds like you have three elements to consider

  1. the file name (you can extract that by using a list file node (and manipulate it later)
  2. the ‘header’ if indeed you file contains the information you mentioned above. The question is: can you separate the header lines from the rest of the data by splitting the file in half. You would initially load the file with File Reader as one single line, drop the data and split the header lines by “:” to get the data into columns
  3. the data itself. You would have to determine where the data starts and read the txt file starting with the respective line (leaving out the header)

Then you would have to combine the three elements back together. Do this with a loop and you can easily process a lot of files.

Sounds complicated but is actually quite doable thanks to KNIME. Maybe you upload some examples and tell us how your output would look like.

1 Like

Thanks to all for your input: The output or the result should be a x,y,z diagram with wavelenght, extinction and time as the axes. I’ve uploaded the following files as an example. USB4J009161__0__14-39-30-858.txt (54.8 KB) USB4J009161__1__14-39-30-969.txt (54.9 KB) USB4J009161__2__14-39-31-063.txt (55.4 KB) USB4J009161__3__14-39-31-158.txt (55.5 KB) USB4J009161__4__14-39-31-268.txt (55.0 KB) USB4J009161__5__14-39-31-363.txt (55.1 KB) USB4J009161__6__14-39-31-457.txt (55.1 KB)

hi @JGWZG,

the hints are correct. You should iterate the files like @ScottF mentioned and define where to start the reading process like @mlauber71 explained. As your files start with meta data before listing the values, you should split this part and assign afterwards the important information (date). Please find the workflow attached, which should help…
Z_022_txt-files.knwf (30.5 KB)

best, Thomas

3 Likes

Here’s my approach:

3 Likes

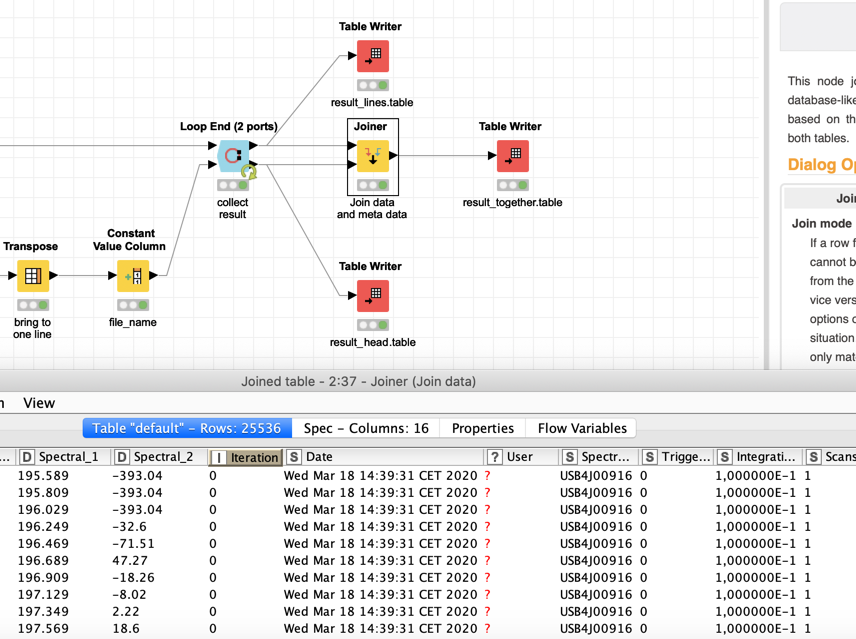
I built a workflow that demonstrates how to import the data and does bring the results together.

You guys are unbelievable, many thanks! I’m unfortunately not able to get on my data tomorrow, but I’m really looking forward to try your suggestions.

2 Likes

Dear malauber71 and elsamuel,
I have some difficulties to implement your suggestions, I think mostly due to my inexpertnes up until now in knime.
@mlauber71: I get error reports: “ERROR Loop End (2 ports) 0:32 Execute failed: Input table’s structure differs from reference (first iteration) table: Column 1 [User (String)] vs. [User (MissingCell)]”
@elsamuel:I think for your approach Palladian nodes are needed, but how to install? I already searched in trusted extensions with no results.
Thanks

Hi @JGWZG,

To install the Palladian nodes, you’ll need to add the following update site: http://download.nodepit.com/palladian/4.1.

The process is described here: Palladian nodes gone after update to knime 4.0

As for your your Loop End problem, the error means that one (or both) of your tables is changing throughout the loop, perhaps the name/number of columns is changing during each iteration. It is possible to configure the Loop End node to allow changing table specifications, but you’ll need to investigate what’s going on.

3 Likes

This topic was automatically closed 182 days after the last reply. New replies are no longer allowed.