working on the latest data challenge I am processing the data using the Parallel Chunk nodes. Nothing special as I am using them almost on a daily basis.
Though, I noticed an extreme UI latency despite having enough system resources available. Please see my screen recording (download).
I can work with the situation and will share the workflow once I have completed the challenge.
Updaate
I believe I figured out what is happening or at least have a good suspicion:
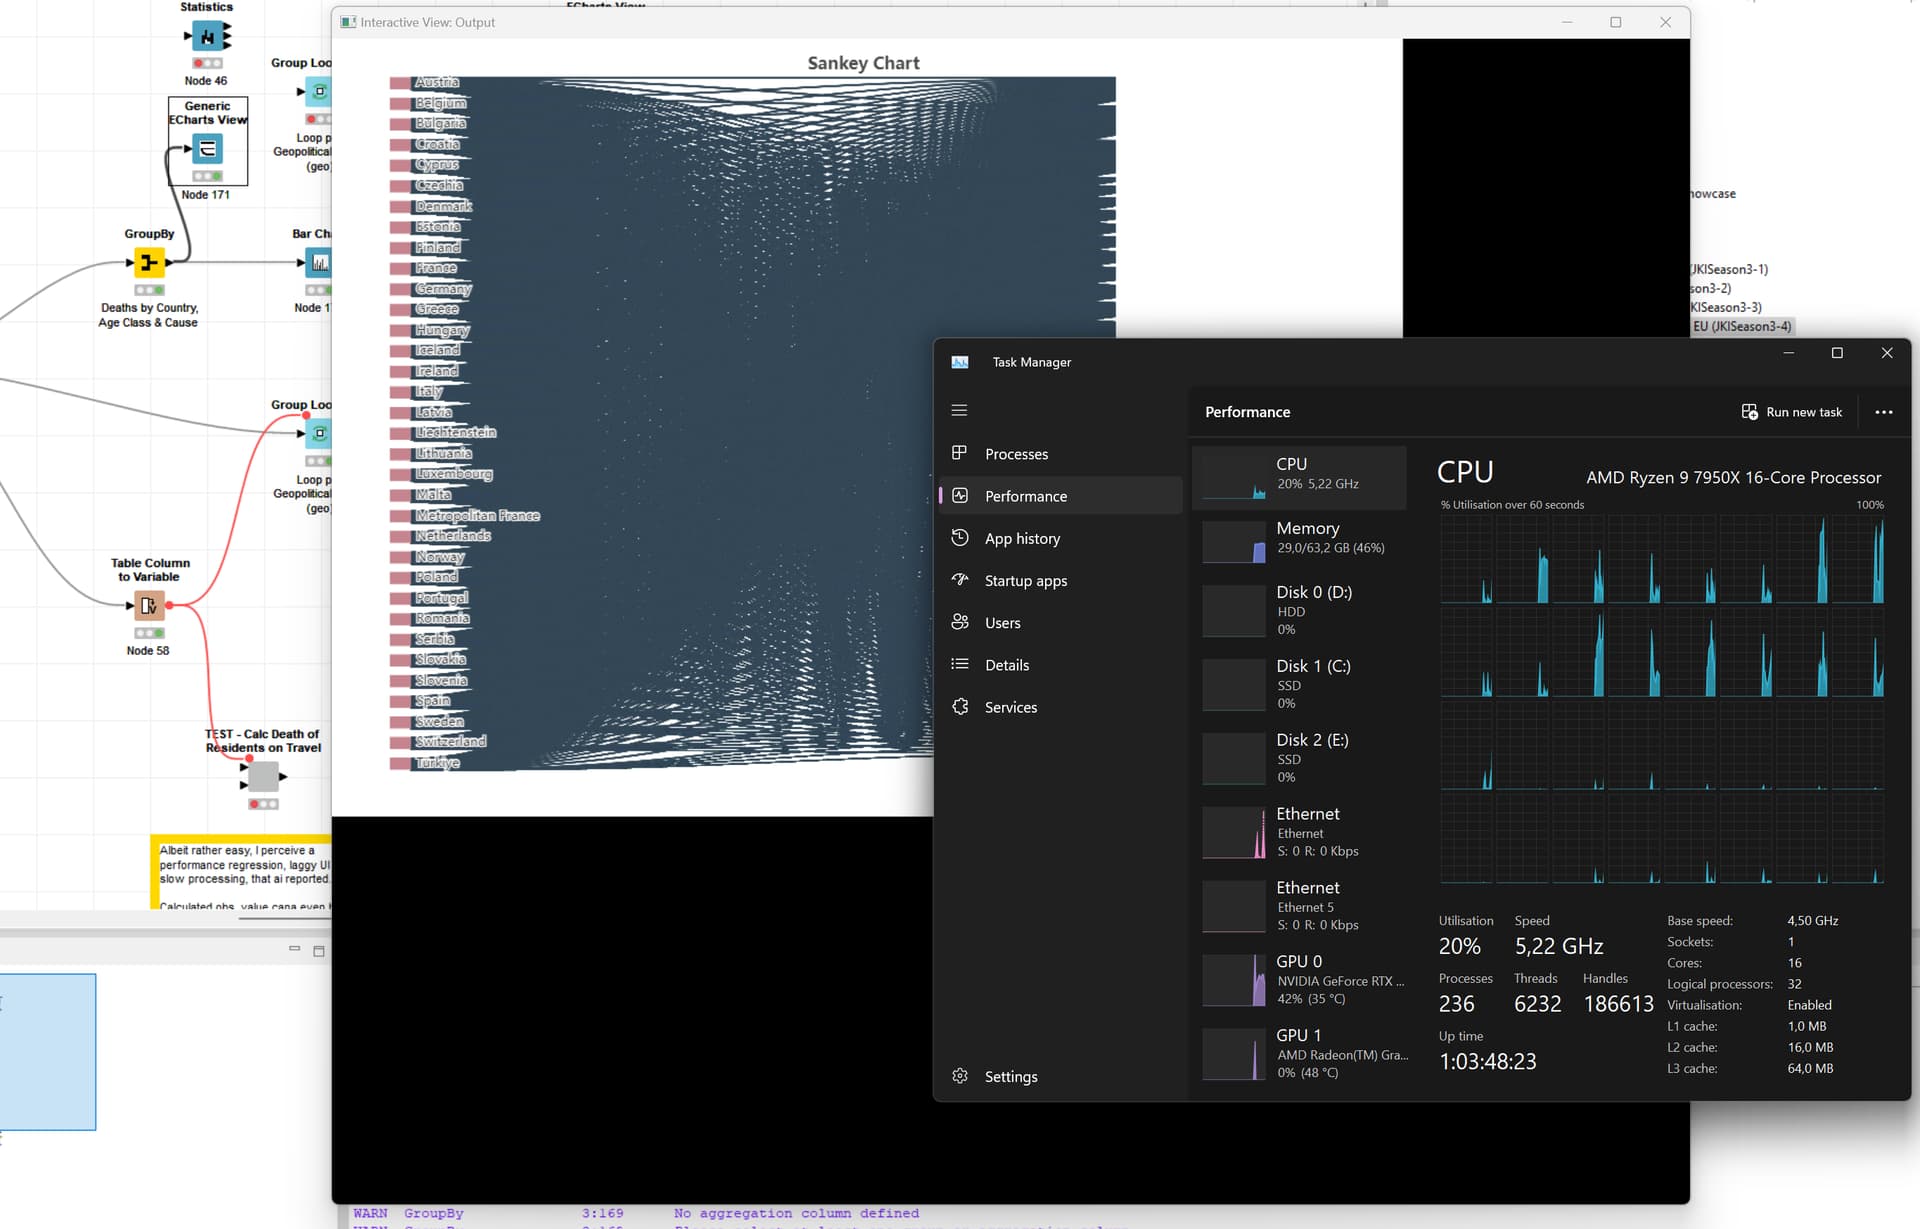
Some CPUs are highly utilized but not all
The UI lag is triggered upon parallel execution indicating that UI rendering is happening using CPU instead of GPU
The rendering process is done on one of the heavy utilized cores causing congestion
The problem I see here … I utilized all cores before in even more demanding processes like web crawling with +10 sessions all while crunching data in another workflow but without any perceived UI lag.
This issue also appeared only with the latest update of Knime or any of it’s extensions. I am doing nothing fancy or totally new either.
Great to see your detailed documentation of the issue. I opened up a ticket previously in relation to performance, and I have went ahead and added a link to this thread under it also and added a +1 to it as they both relate to hardware not being fully utilized properly.
I’ve reproduced this kind of today. killing “equo chromium helper” process solved it. Windows11 with KNIME 5.3.3.
scenario: while working an a workflow, with several other workflows also open in other windows, the CPU usage went over the roof suddenly. It made the UI lag too.
I had something possibly similar with KNIME 5.4 today. The MUI has been very sluggish with a couple of workflows open, and switching between workflows or switching in and out of metanodes has been a continual series of waiting a good few seconds for it KNIME to switch.
I have also seen a high incidence of the KNIME 5.4 “unresponsive UI detected” message that offers me the opportunity to “save and restart” or wait. I haven’t had to restart, as waiting is sufficient, but the message keeps bugging me, and to be honest was getting quite annoying when it kept popping up as I waited for a workflow to run, and as far as I could see it wasn’t actually unresponsive. It was simply executing a loop. I’d clear the message and then maybe 30 seconds later the message popped up again.
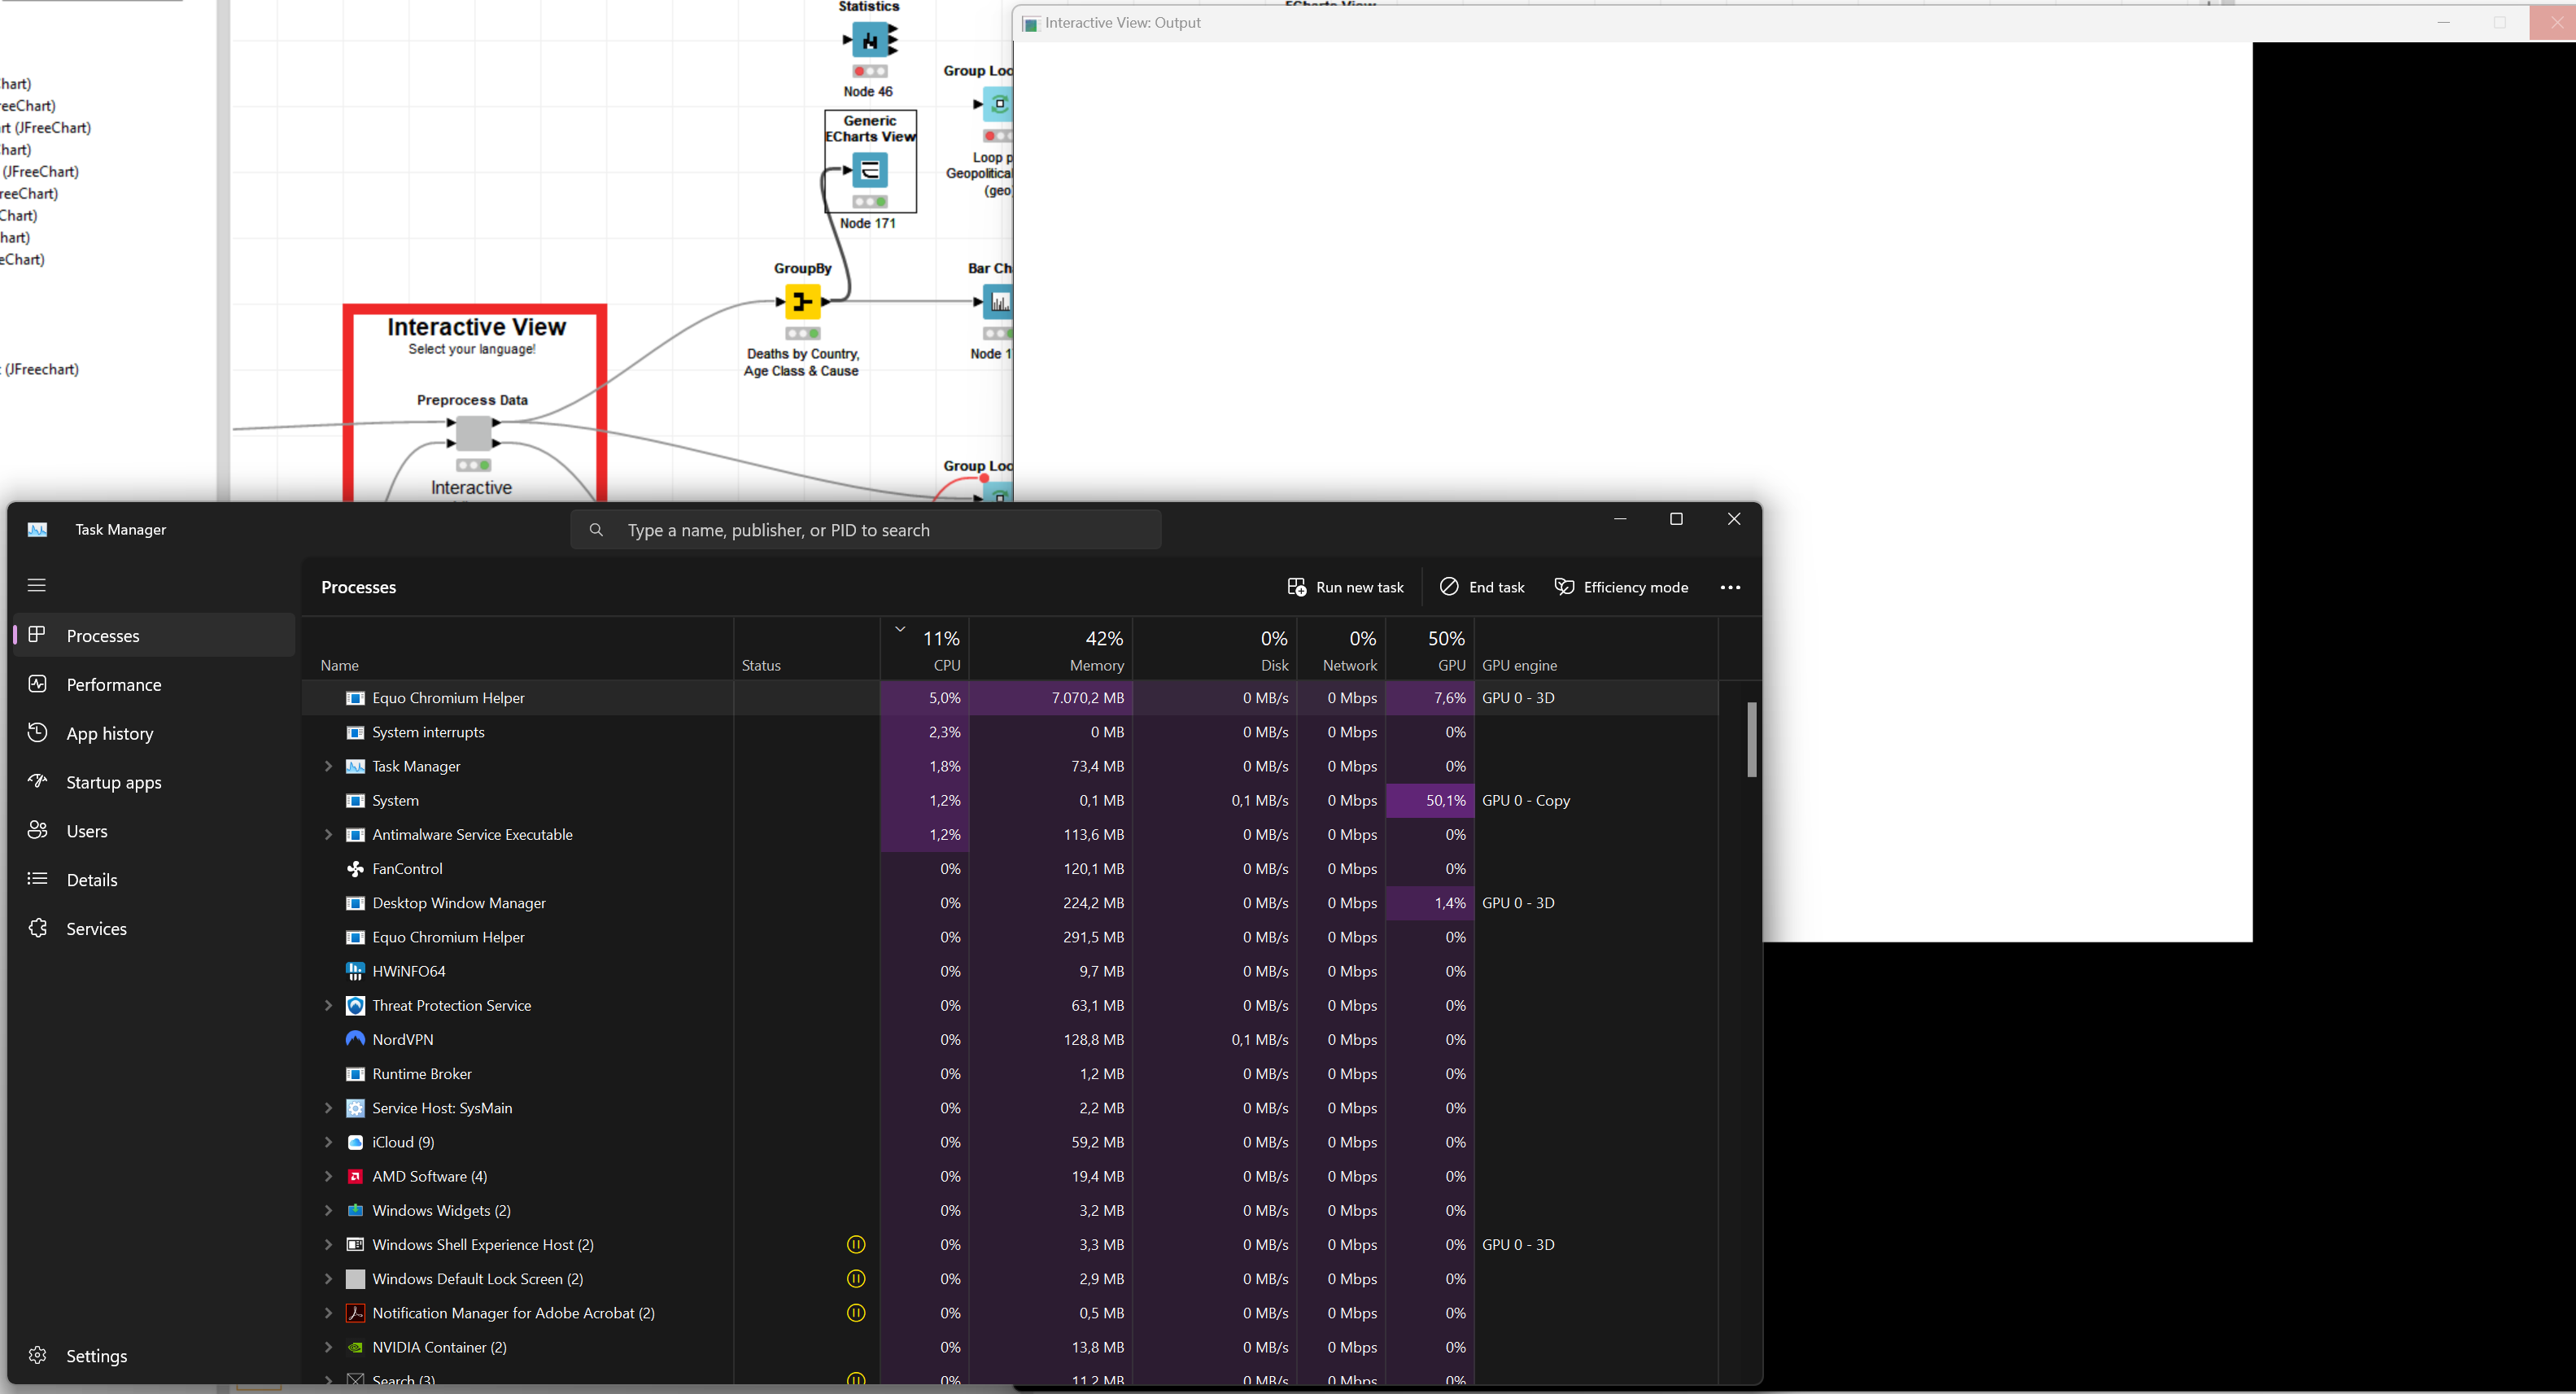
Having decided to finally shut down KNIME to give the CPU some time off (the fan has been constantly running), I noticed that it made no difference to the fan noise, and opening Task manager I could see that a number of Equo Chromium helpers were still running. I thought I’d give it a chance to finish doing stuff, if that’s all it was but some 20 minutes later (as I write this), they were still there even after KNIME had long since closed.
Not only that, but they continue to consume a high percentage of my CPU (and the laptop fan, from the constant noise it’s making!)
I didn’t spot it at first but in fact I had also been running KNIME 5.3 at some point earlier today, and looking at the above screenshot you can see there are Helper processes for 5.3 still running too, with one of those also consuming high CPU. I’m guessing that this is why KNIME’s UI has been particularly sluggish all afternoon?
Another 5 minutes further on, and still they execute…
@takbb can you check whenever the utilization is on one core only? I noticed that this happened to me pretty much all the time. With the recent conversation amongst the start alliance about performance and our possible findings about MUI, I believe the culprit of any perceived performance regression is due to the poor multi-threading capabilities (under certain scenarios).
Check out what @mwiegand suggests, I think including that on the ticket will be helpful if you notice it only using one core. I added another +1 to the ticket.
Do I understand correctly that the slowdowns, particularly those with orphaned equo chromium helpers, have nothing to do with actually generating large images (as was the original context)?
Since version 5.8, I have had the same problem with ‘equochro_helper.exe’. As soon as I open a workflow, the CPU usage exceeds 80%. However, I work on a remote computer, and the problem only occurs here.
It is essentially the UI process that is responsible to render the workflow. We have recently changed the rendering from an SVG based approach (that works mainly on CPU) to a Canvas based approach (this can make use of the GPU of a computer). It turns out that the Canvas variant is really strong for large workflows if there is a GPU available, but it performs very poorly in scenarios where there is no GPU. Most of these remote scenarios either have no GPU available, which is why the performance feels not as good. For these cases I would recommend to go into the settings and change from the WebGL based rendering to the old SVG based rendering. We are currently trying to identify the use cases for such remote setups and trying to explore solutions for it.
What is your use case why you are using this remote setup?
Hi Daniel and thanks for clarifying this…
I do not have a GPU available, so I will change the setting.
Don’t know if would be technically possible to auto detect this (availability of GPU) and change the setting accordingly?
let me clarify this. I am not taking about an external GPU that is now required. Most laptops come with an integrated GPU that should already be sufficient. Do you have no GPU available at all or just no dedicated?
As for your suggestion, something like that might be possible but maintaining both rendering mechanisms takes a lot of effort. In a beste case we find a solution to support both use cases without having to maintain two rendering techniques.
I have no dedicated ‘external’ GPU, not sure how to check if I have an integrated one.
I understand your point about having to maintain 2 different rendering techniques and very likely in the near future almost everyone will have some form of GPU available.
For the moment, I will play around with the setting and see which one works best - it is not a big issue for me (and maybe ask Father Christmas for a GPU board…)
Thanks a lot for bringing up that problem and solving it!!!
I am just updating KNIME in our institute from an old KNIME to the most recent LTS version 5.8.1 and faced the same issue, that KNIME was under the new UI not useable due to 100% CPU use caused by that exe. It would have been a nightmare and I am glad that there is the solution to go back to legacy mode. We are using virtual environments here. After changing the setting the exe is still shown in the taskmanager, but not at 100%. Solved.
Hi @DanielBog , an example use case that I had in my last place of work was long-running workflows. As I was working from home, I was connecting to the corporate network with a vpn, and for most of my KNIME work, I would run on my laptop. However, there were many workflows that I would need to run over the course of several days, even weeks, as they were performing (very) large database migrations from Oracle into Snowflake. This was impractical on my laptop since it would mean the laptop could not be disconnected and especially with a vpn, the connection would last a maximum of about a day before automatically being terminated.
The modern way (which I dislike, but that’s another story) is to use cloud VMs to provide the kind of operation that we used to use dedicated on-prem servers for. In my case we were using Amazon EC2, and as a consequence there was no dedicated graphics hardware. Even with SVG rendering, I found KNIME on the VM to be less responsive than on my laptop, but I just put this down to it being remote, and possibly not a particularly powerful VM, and of course lack of graphics could have played a part here, but it was generally workable nonetheless.
So I certainly don’t see using remote VMs as an unusual use case. They were certainly a necessity for any long running workflows. It’s possible of course that this is a case where using a Team plan might be an option, but this rather depends on the data sources, and data sinks. It’s ok for example if they are all in the cloud too, but sometimes it is necessary to still have access to non-cloud databases or file systems (which was the case in many of my workflows) and, correct me if I’m wrong but I’m not sure that running a workflow on the hub would be able to support this.