Hi I have daily water stages at 100 different gauging stations. Its a 30 years period of records and each gauging station is missing some data. Sometimes whole years are missing. My idea is to fill in the missing data using the gauging stations which have the best R2.
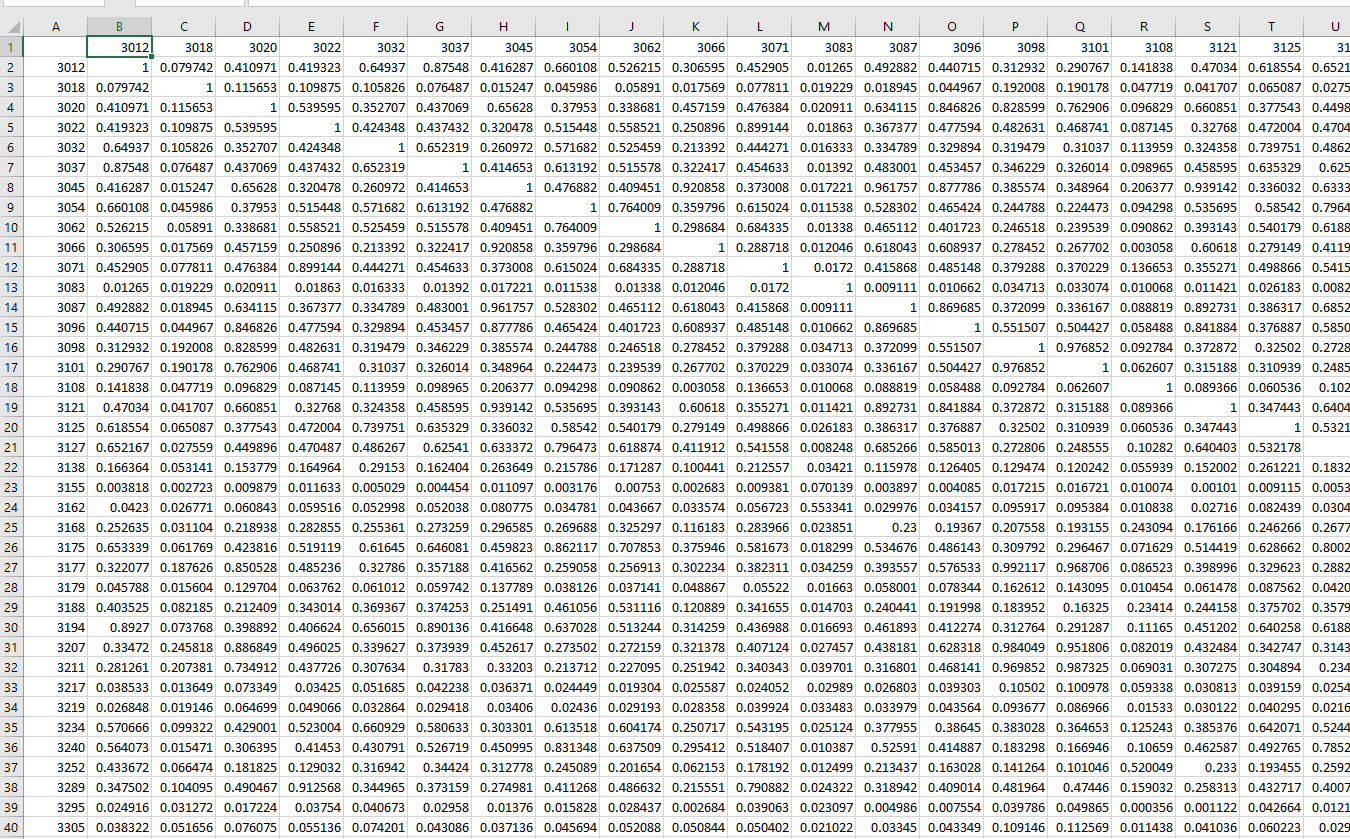
So I used Linear correlation node and have gotten the matrix. Looks like this
Any idea where to start? I know that there is node called linear regression learner, but you can only do one by one match. Or one with many.
I would like to automate the process to get knime to find the highest R2 in the matrix for the particular station, and find its matching station, and then create linear correlation between them and use the expression to fill in the missing data.
Small task, huh? Any tips how to start? Maybe someone has a workflow?
Thanks in advance
Sorry for the late answer!
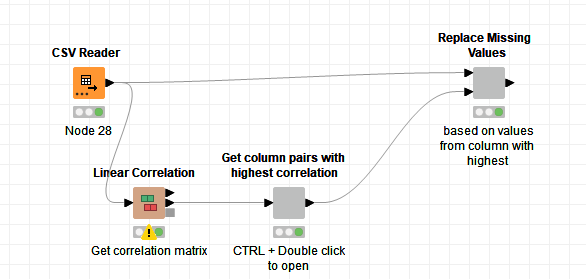
I created a small example that shows how you could do it. There are probably other solutions as well.
I created a sample data set and then used the Linear Correlation node to mimic your example. The first component retrieves the highest correlated column for each of the available columns. The second component is then used to iterate over the pairs and replace missing values based on the highest correlated columns.
If there are any further questions feel free to ask.
@Dalmatino16 I have an example on the hub how to impute missing values with the help of the R package amelia. There is also a specific attempt to do that for time series somewhere on my computer (will see if I can prepare that later for the hub).
Also I am planning to bring a few model based missing imputation techniques into KNIME workflows, that is not ready yet.
Thank you guys, its never too late. I will check both workflows and see what fits me best. I will be free to ask when I get stuck. And I don`t doubt I will, ha, ha.
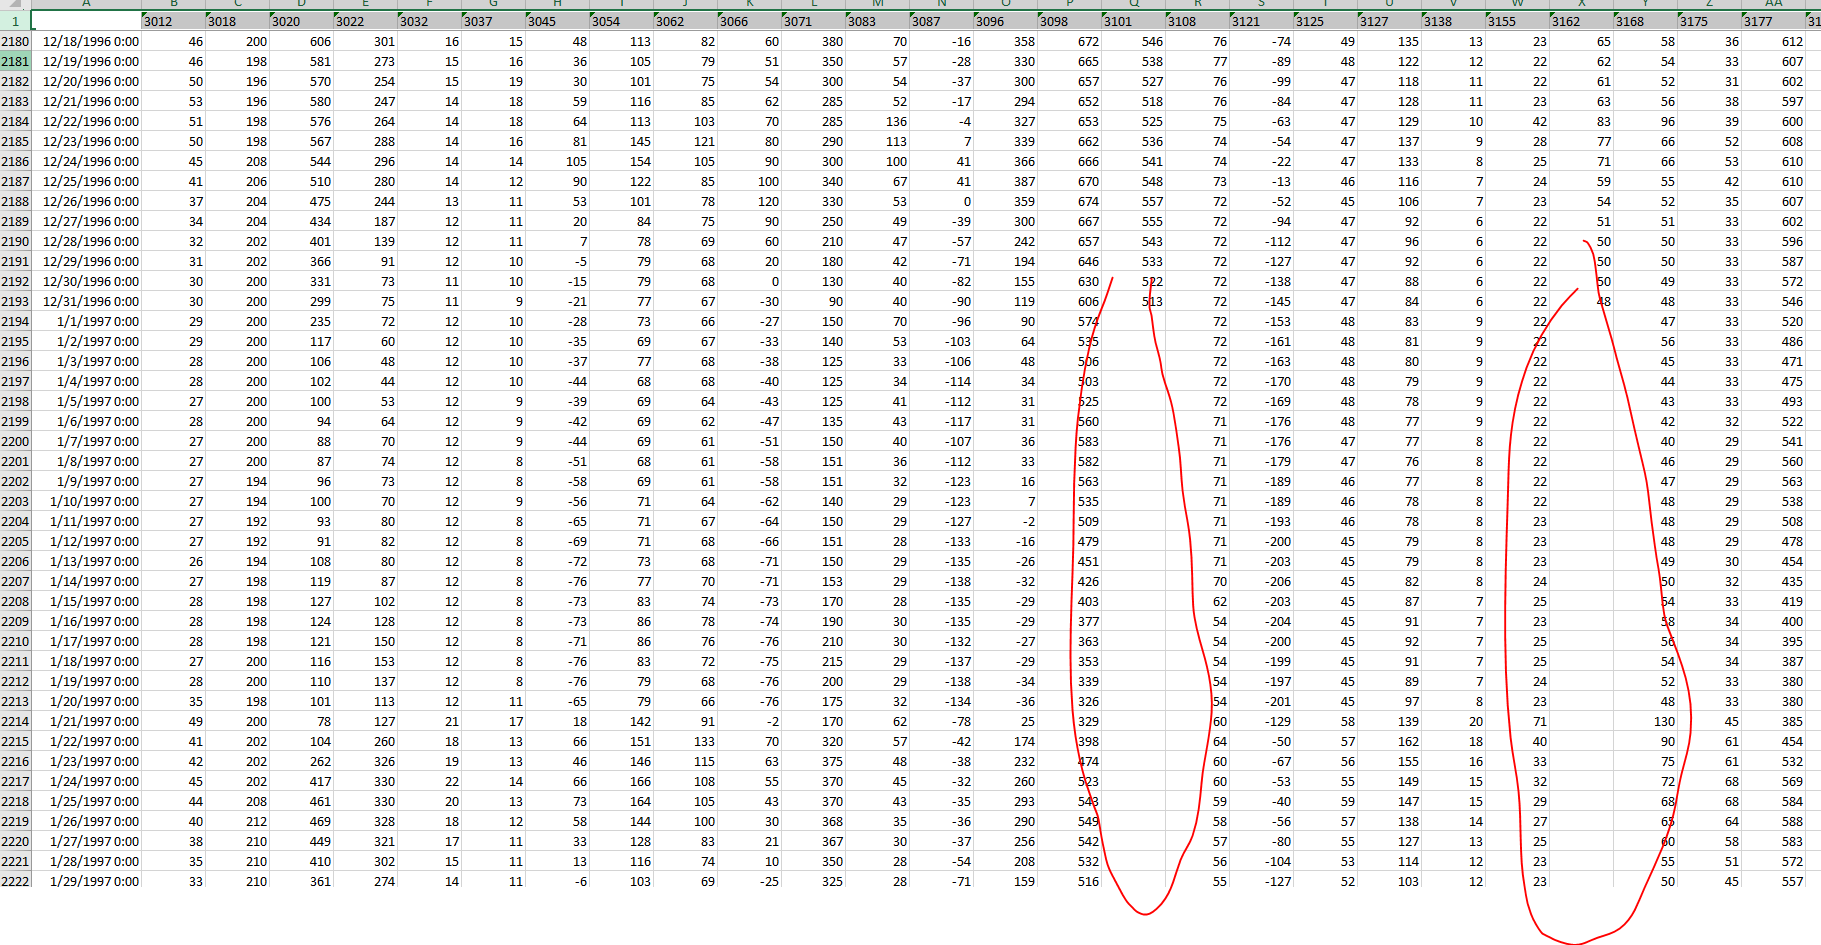
Hi Julian, I tried your workflow with modification as shown
And it worked as intended ! But, I have an extra problem - sometimes highest correlated column also has gaps, so I would need to move to the next highest and use that one for filling the gaps and after that one is exploited move to next one and so on until all the gaps are filled. Do you know what I mean?
Since I am new to Knime, I also noticed you worked with two gray nodes. Are those custom made by you?
And I needed to install a Knime extension to use it.
You are right! Currently, it only uses the values from the column with highest correlation, no matter what values these might be. I will have another look at the workflow to see how I can workaround that. The workflow contained some nodes from other extensions which were needed to run it. That’s why you were asked to install them. The initial KNIME installation comes only with the most important extensions to keep users flexible. Extensions can simply be installed via File → Install KNIME Extensions. All of the KNIME extensions and community extensions are free and open-source as well.
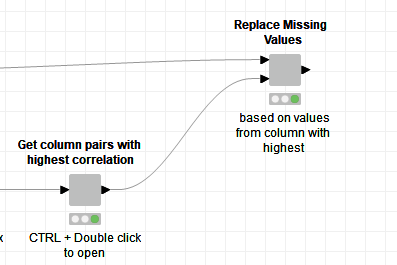
These grey nodes are so called Components. You can always open a Component by either use CTRL + Double-click or Right-Click → Component → Open… ! In order to create a component, you can select multiple nodes and then use Right-click → Create Component. Note: There are also Metanodes (after using the Right-click, you can see that there is a Create Metanode option, too.) Metanodes are just for hiding complexity, components have some more advanced usecases but can of course also be used just to hide complexity. However, as mentioned there are different use cases for them:
Creating your own configurable node with so called Configuration & Widget nodes
Creating composite view (i.e., having multiple visualization nodes in a component to create interactive views)
Components can be saved & shared. Either to your local workspace or to a KNIME Server meaning that you can simply reuse components across multiple workflows. No need to reinvent the wheel every single time
There is a whole documentation around components which you can find here: KNIME Components Guide
may be you can think about not only focus on the absolute values but further on the relative changes of the water stages. If you identify gauging stations with a similar stage change you my have the option to cluster these stations and use the average relative change.
Hi, the thing is that all of these stations are not nearby, some are at different basins, so one may have simillar relative change but only by accident.