First of all: Welcome to the world of KNIME.
Lokking at you challenge the pivot node Pivoting — NodePit comes to my mind.
That will work in case you are “0” or a “1” to identify whether a patient is with HD or not.
At first step you need to double the second column and ensure that it’s type is integer. That’s because we do some simple math now.
So the table looks like
col1 | col2 | col3
C1 | 0 | 0
C1 1 | 1
...
Now apply the above mentiopned pivot node to the table and configure
Group by col1
Pivot by col 2
Manual aggregation sum(col3)
Manual aggregation count(col3)
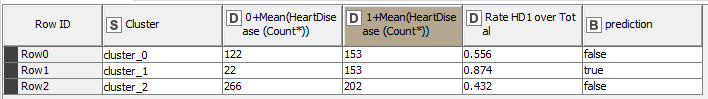
The pivot will give you all required figures to check your limit of 80%
Indeed, the Rule* nodes (Rule Engine, Rule-based Row Filter, etc) do not allow you to do manipulations/calculations. These manipulations/calculations have to be done beforehand.
So, if we go with how you are doing it, just use a Math Formula node before the Rule-based Row Filter where you can do your count*0.8 and save the results to a new column, let’s say count_80.
You can then apply the rule of count_80>count(HD1) in your Rule-based Row Filter. You can then also remove the count_80 column with the Column Filter.
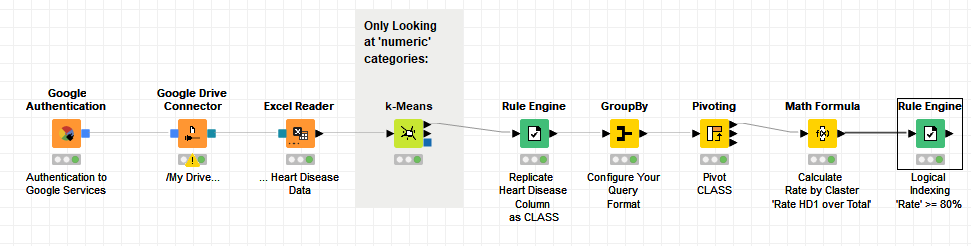
I had a look at the data that you provided and in a conceptual example you can apply something similar to this workflow. 20211203_heart_disease.knwf (98.4 KB)
I tested the KNIME provided k-Means node, by applying 3 clusters in this example. The node only works with numeric categories.
I did a fast check in R to estimate the right number of Clusters applying the Elbow method; converting the text categories ‘as.factor’ and using the factor number in the method for the 11 independent variables… that’s why i selected to choose 3 clusters.