Hi @umbs
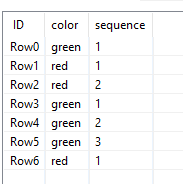
Am I right that you are looking for the largest group of consecutive rows of either green or red?
Something like this:
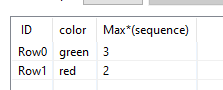
Create a sequence of consecutive greens or reds
And then find the max values within the entire dataset?
In general, try to be as complete as possible in your questioning. Include current input, expected output, screenshots, data sets, workflows, etc. as much as possible in the beginning. The more you provide, the more accurate the help will be
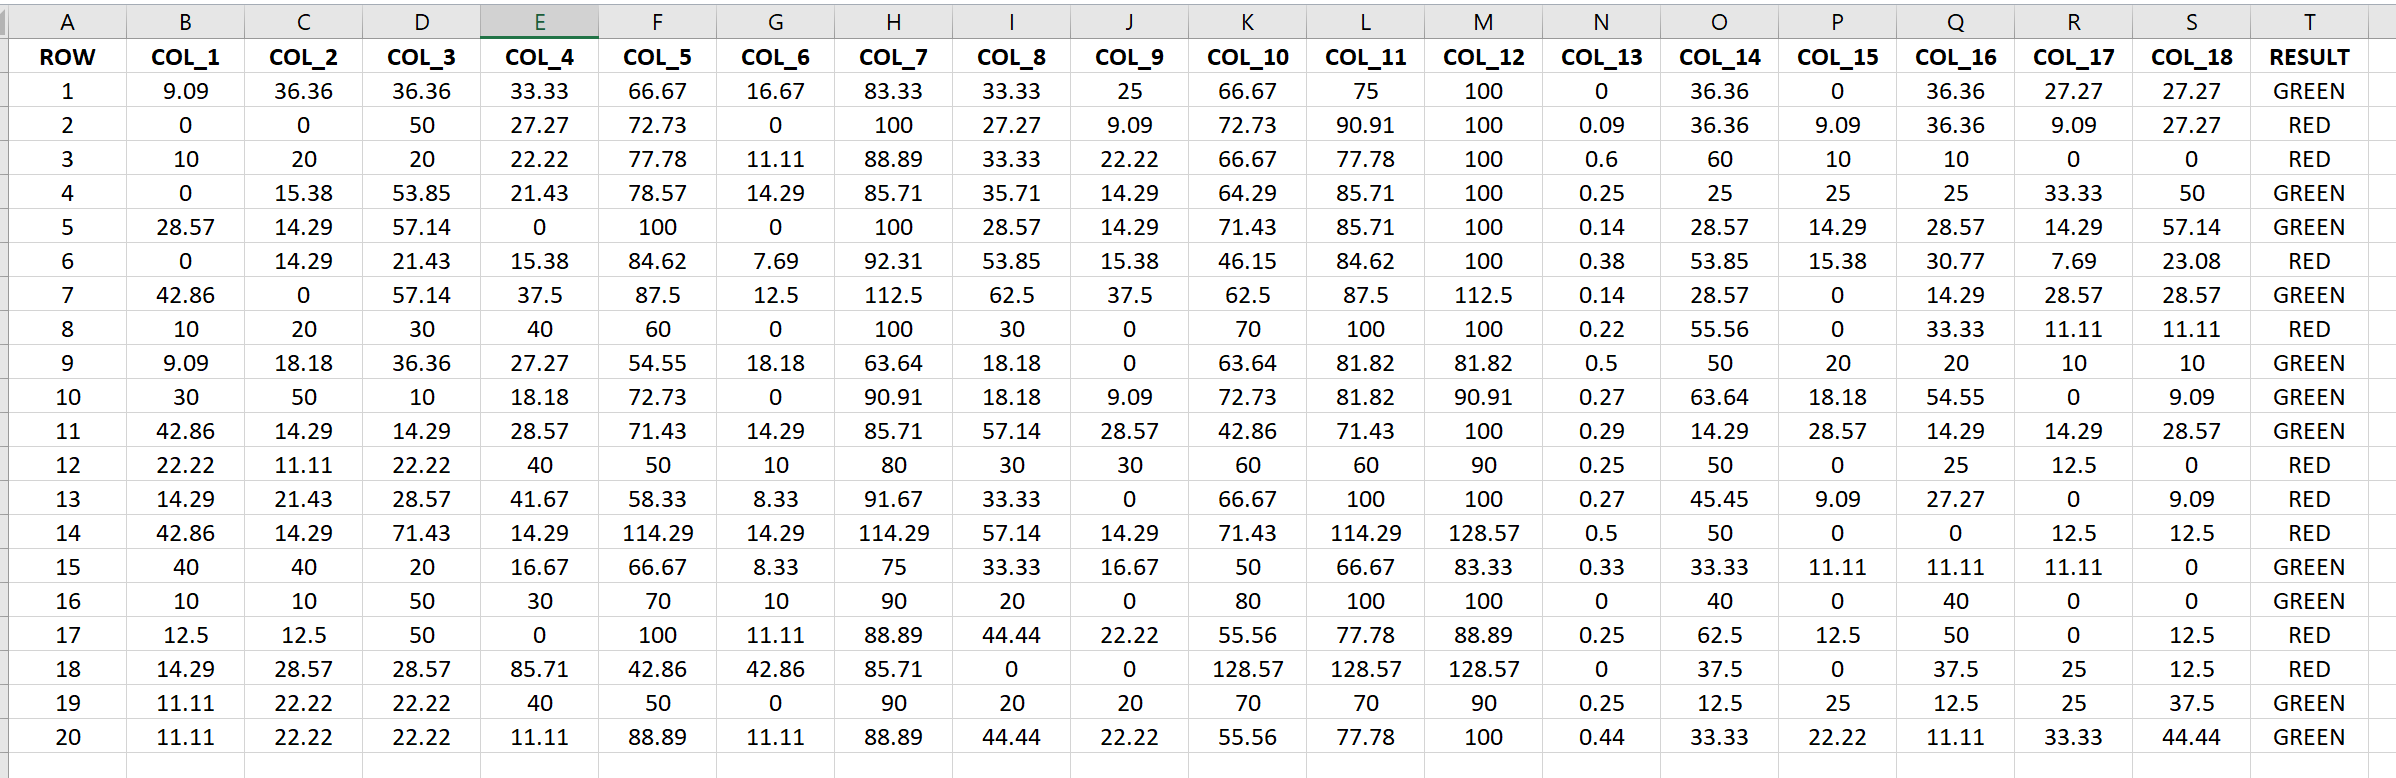
I would like to find a filter that would group by Result all the records including the greatest number of Green rows and the least number of Red rows using in the condition as many columns as possible, the “distance” between the two groups must be high.
Hello @umbs, welcome to the community
Am I correct to assume that your requirement is more towards ML clustering ? [binary classification]
Also it seems you also need to find a function or technique like SVM, regression etc to label your result as GREEN or RED using the 18 columns.
And when you speak of distance, how is it supposed to be calculated ?
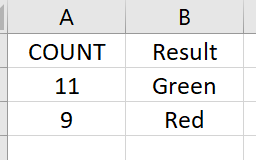
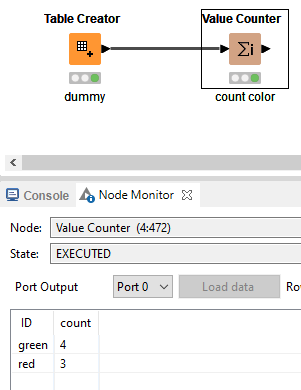
Though if you just need the count of GREEN and RED (after getting the best result), you need to use group by node on result column with count aggregation
To be honest, I don’t see any column that can be used as group based on your screenshot. If you have a proper group column somewhere which designates this, the GroupBy Node is a proper fit.
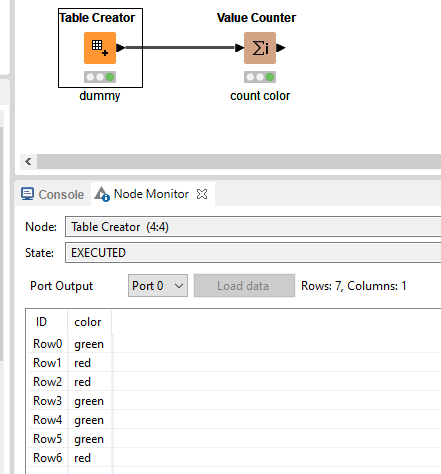
If you’re just looking for a color count, like in your screenshot, I would use the Value Counter node.
I don’t see any group and (probably) don’t understand the goal correctly but you could treat it as a binary classification problem, map colors to 1 and zero and then train a ml model on it. This can give you the importances of each column contributing to the color.
br