My data set (Neighborhood Data, attached here) contains a series of rows with nine potential designations in a Price Strategy column. My problem is the actual data per neighborhood may only populate 2, 3, or 4… of 9 total Price Strategy categories. I need to keep all rows with a calculated designation and populate the remaining categories with “0”.
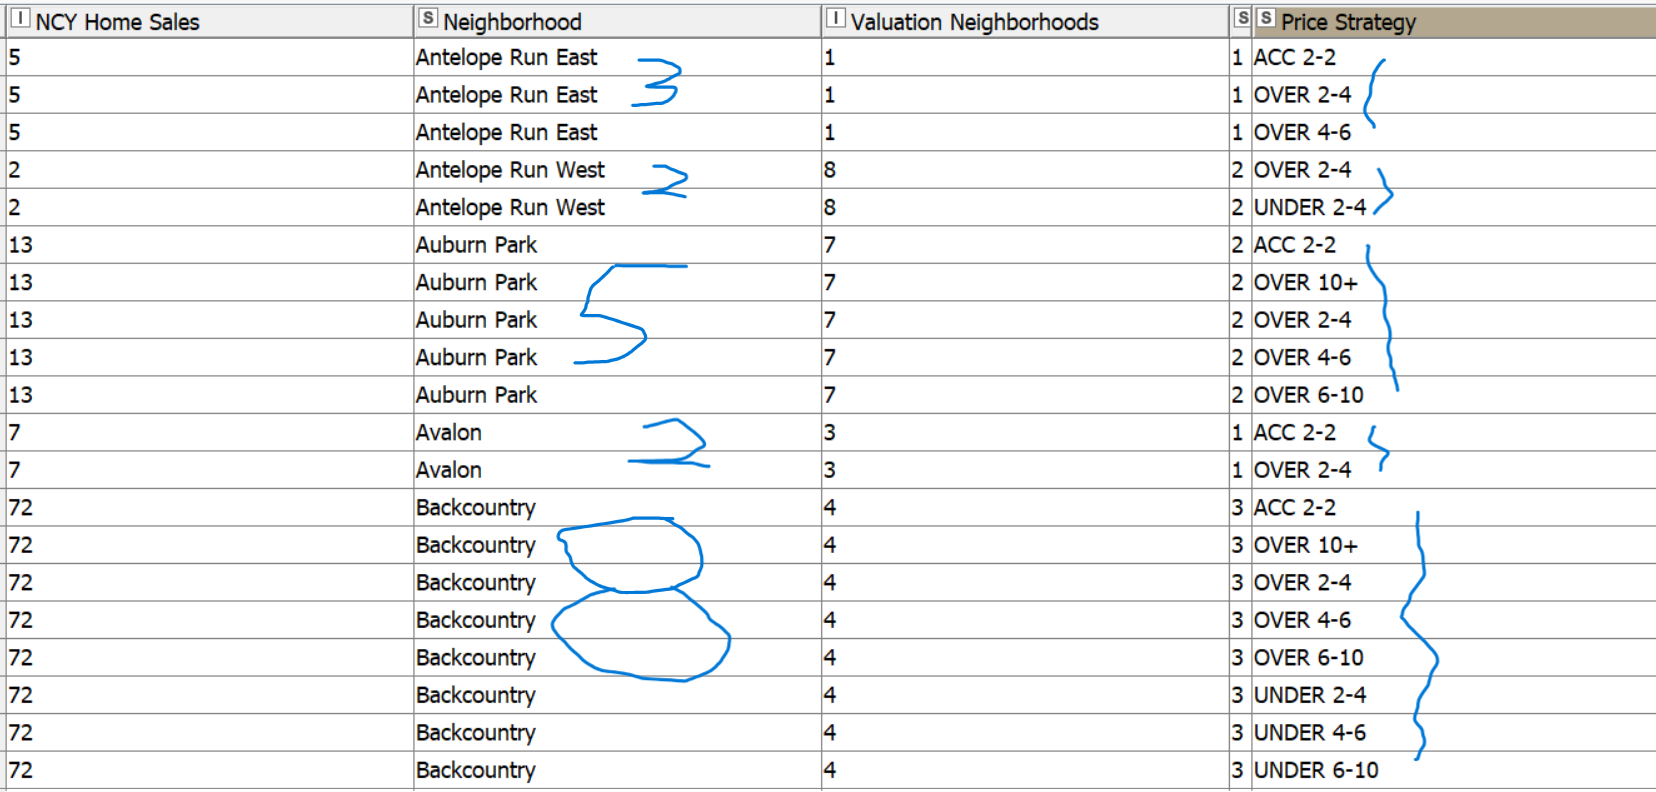
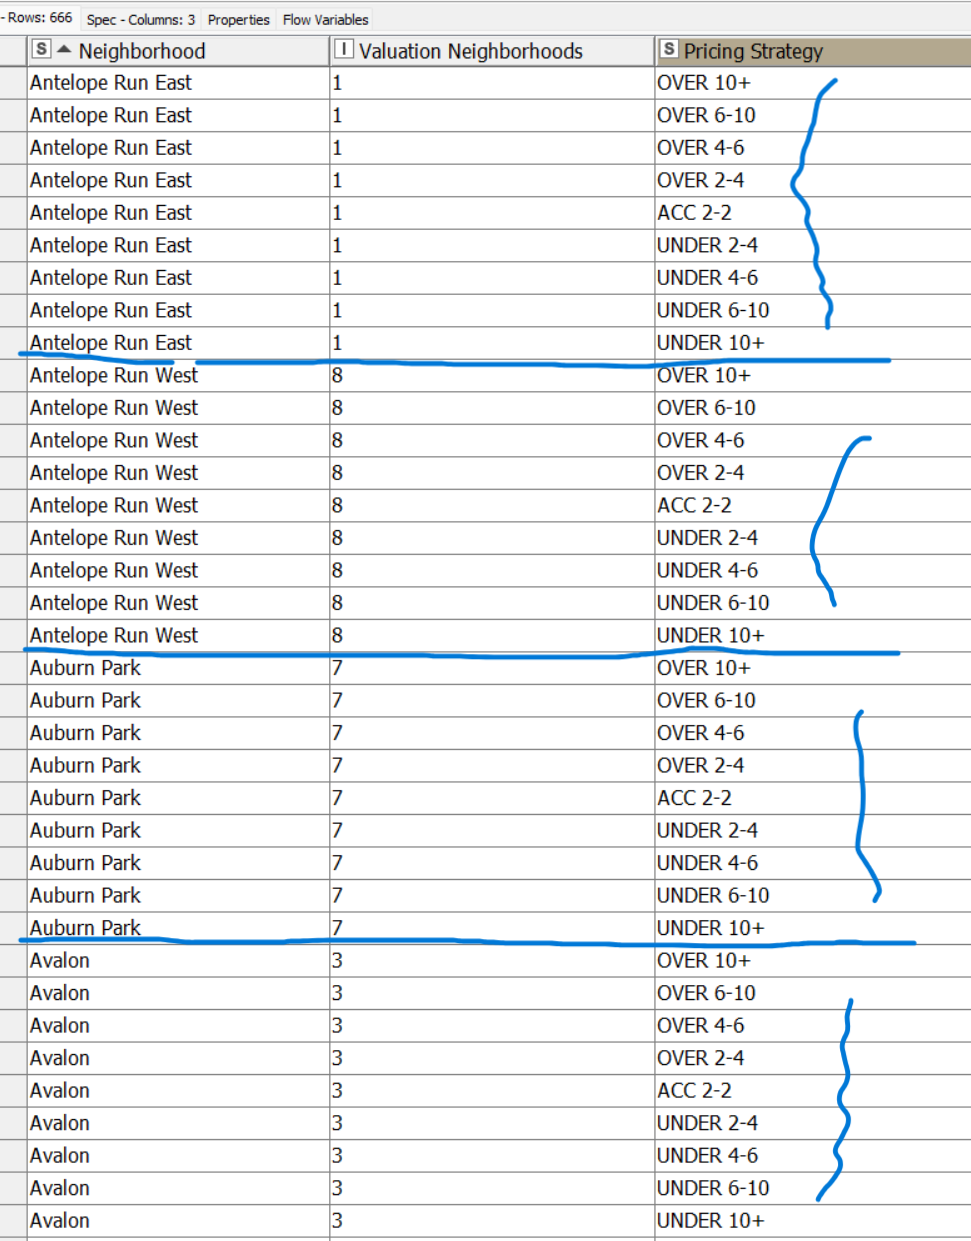
So I created a Dictionary (attached) of all Price Strategy categories that I am trying to force into each of 74 neighborhoods using a Group Loop. At the end with each Neighborhood having all 9 Pricing Strategy categories.
At the end of my Group Loop my results appear as below for each neighborhood.
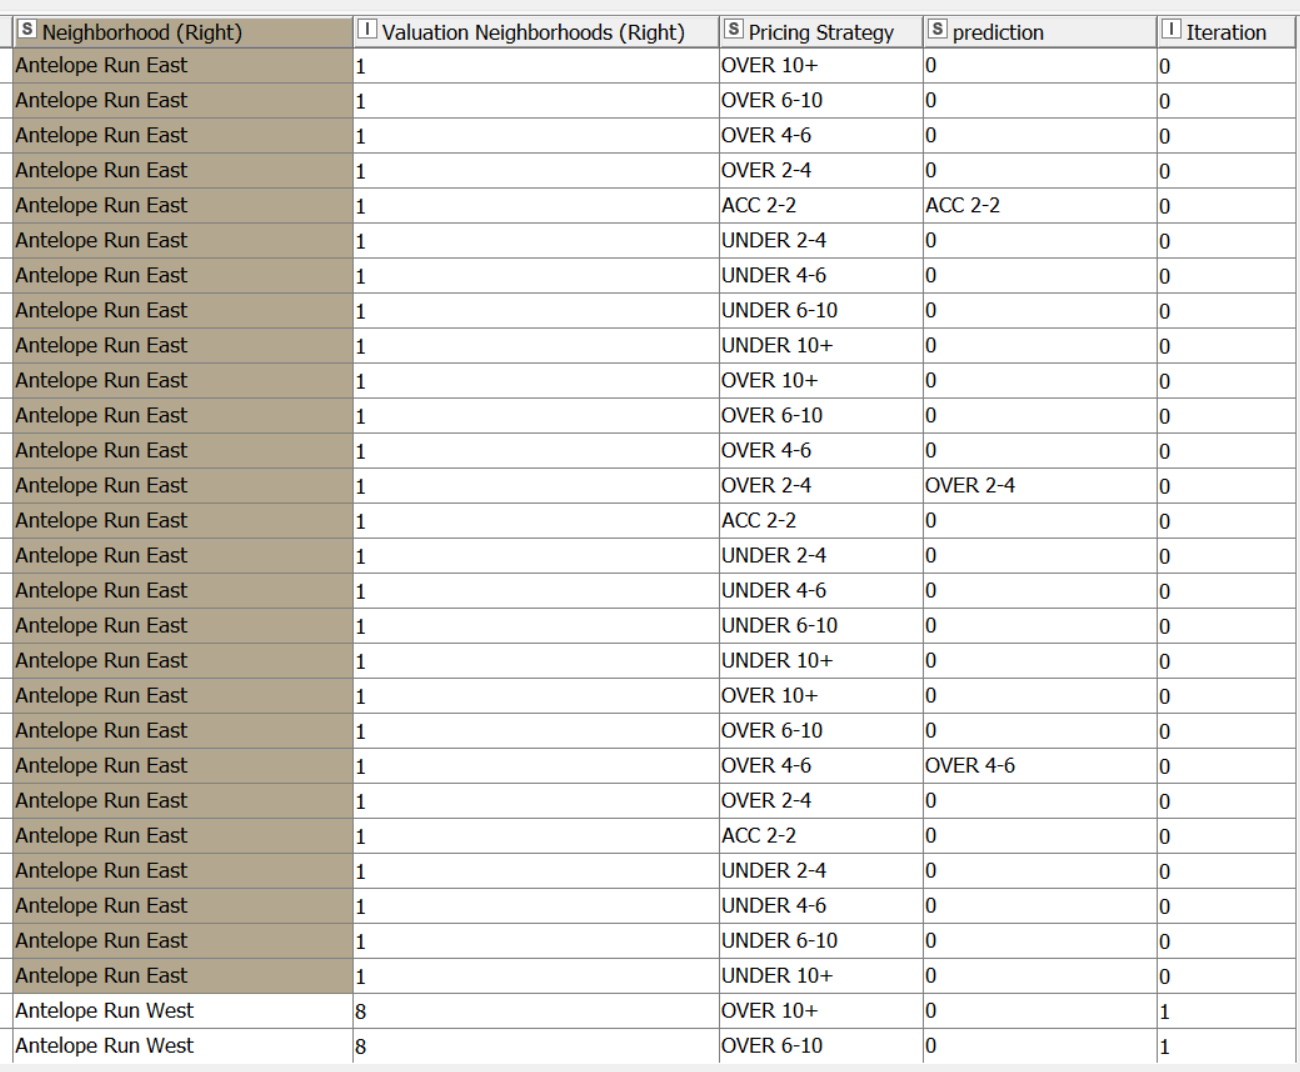
I need to filter out duplicate columns–BUT ENSURE I keep the rows designated by the Rule Engine as populated real data for each neighborhood (Pricing Strategy = Prediction). Then I just need one-each remaining “0” rows for the nine categories in the Pricing Strategy Dictionary
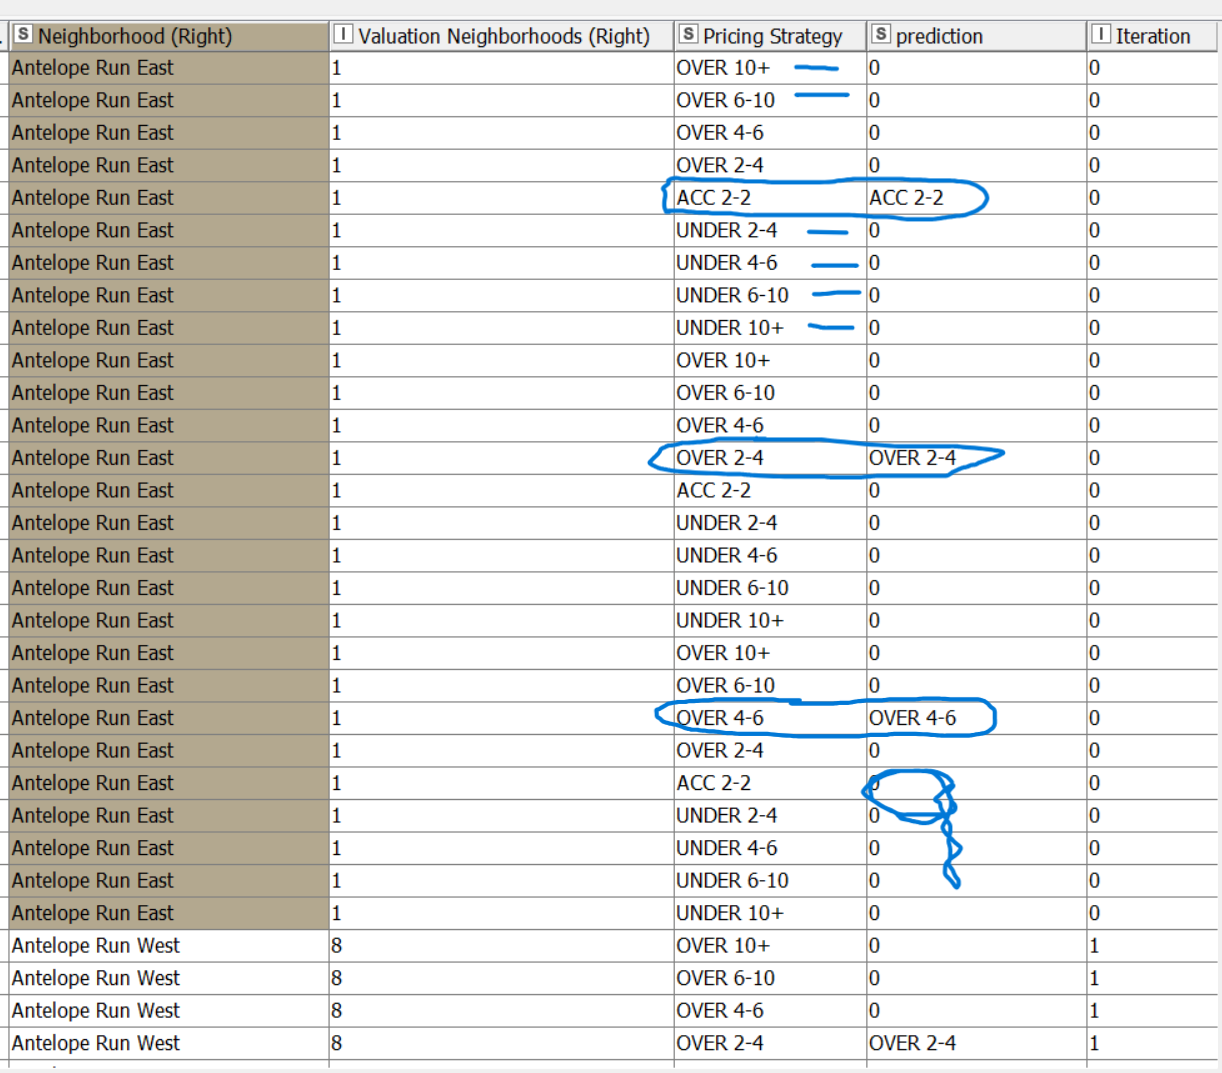
The standard Duplicate Row Filter certainly removes the duplicates, but often removes the ones I need to ensure keeping (Pricing Strategy = Prediction).
Please keep in mind that each neighborhood differs in the number of rows where Pricing Strategy = Prediction, and I need to always keep these, then use up the remaining Pricing Strategy categories with “0” until I have a set of nine in total for each of 74 neighborhoods. Filtering equals always saving all Pricing Strategy = Prediction, then removing duplicates while always having 9 total designation in Pricing Strategy as defined by the Dictionary.
Any suggestions are appreciated, thanks.
loop end results.xlsx (401.6 KB)
Neighborhood-Data.xlsx (51.9 KB)
Cross-Joined-Neighborhoods-To-Valuation-Neighborhoods-Dictionary.xlsx (15.7 KB)