I have faced a few issues about stability in the recent past up until the point where my whole system, as it ran out of memory, crashed.
After repetitive attempts to further pin down a possible cause I noticed that the RAM is not fully freed up respectively garbage collection, even if triggered manually, isn’t releasing the allocated resources.
I also made aa heap dump after running the garbage collection a few times (>6 GB). Let me know is you want to examine it.
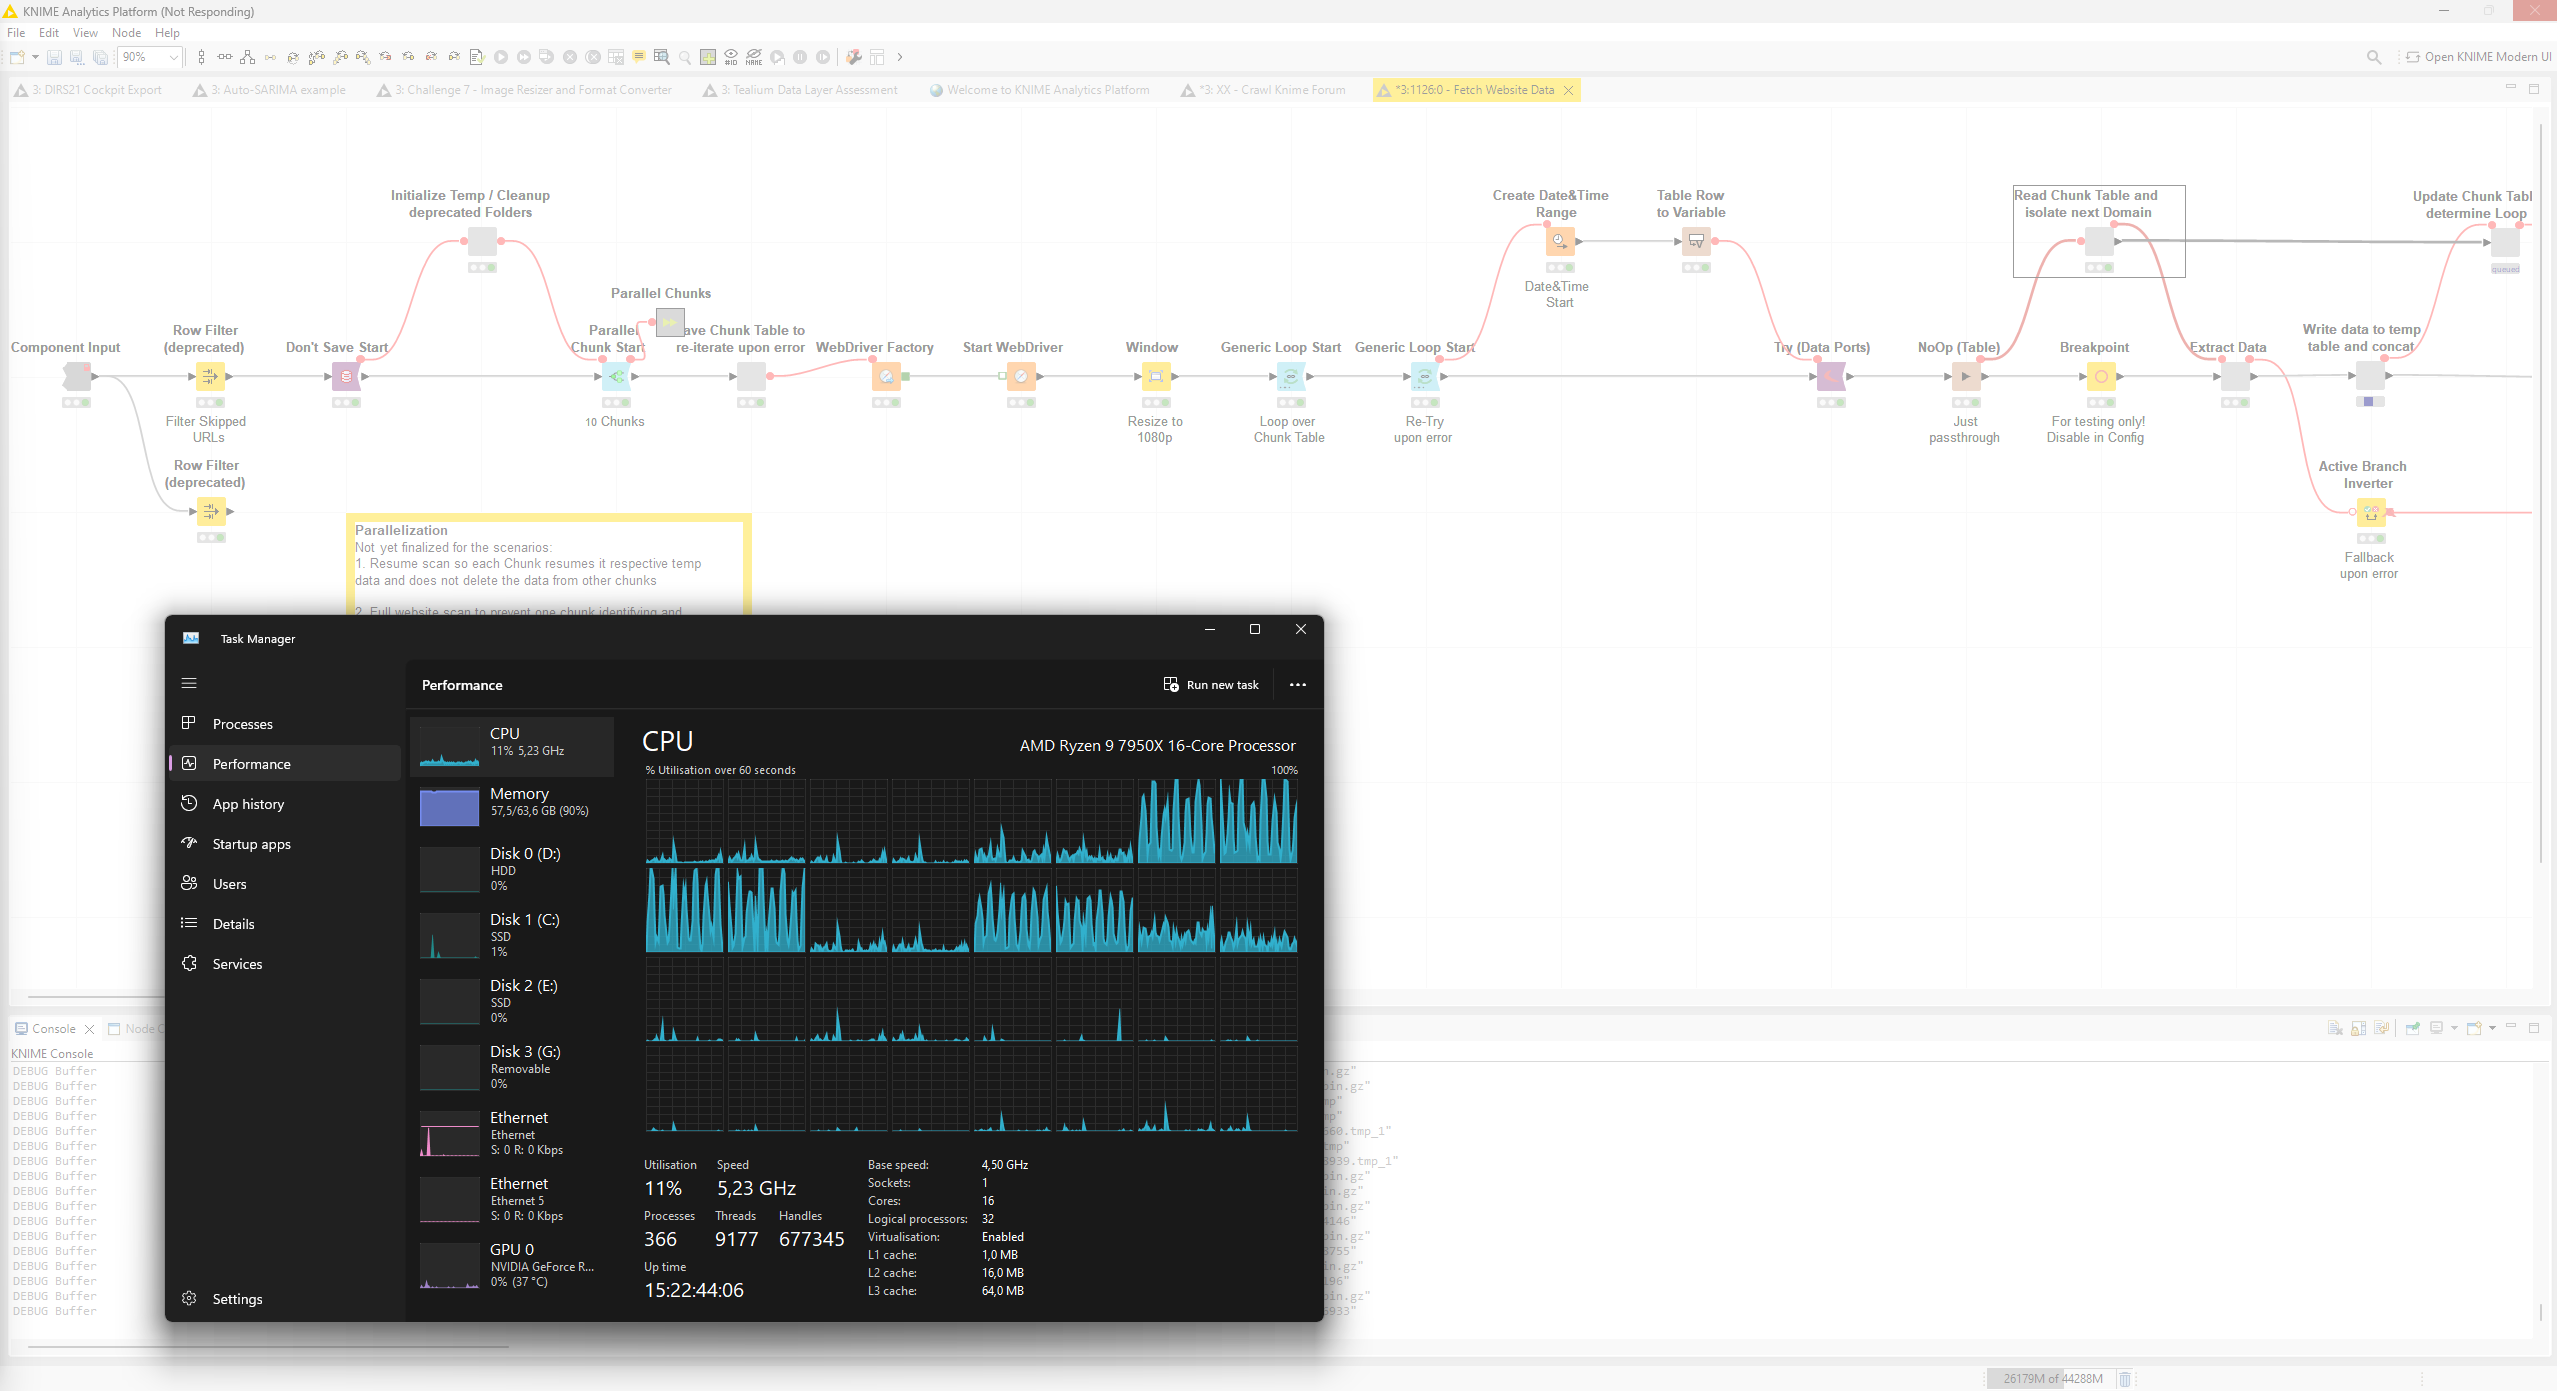
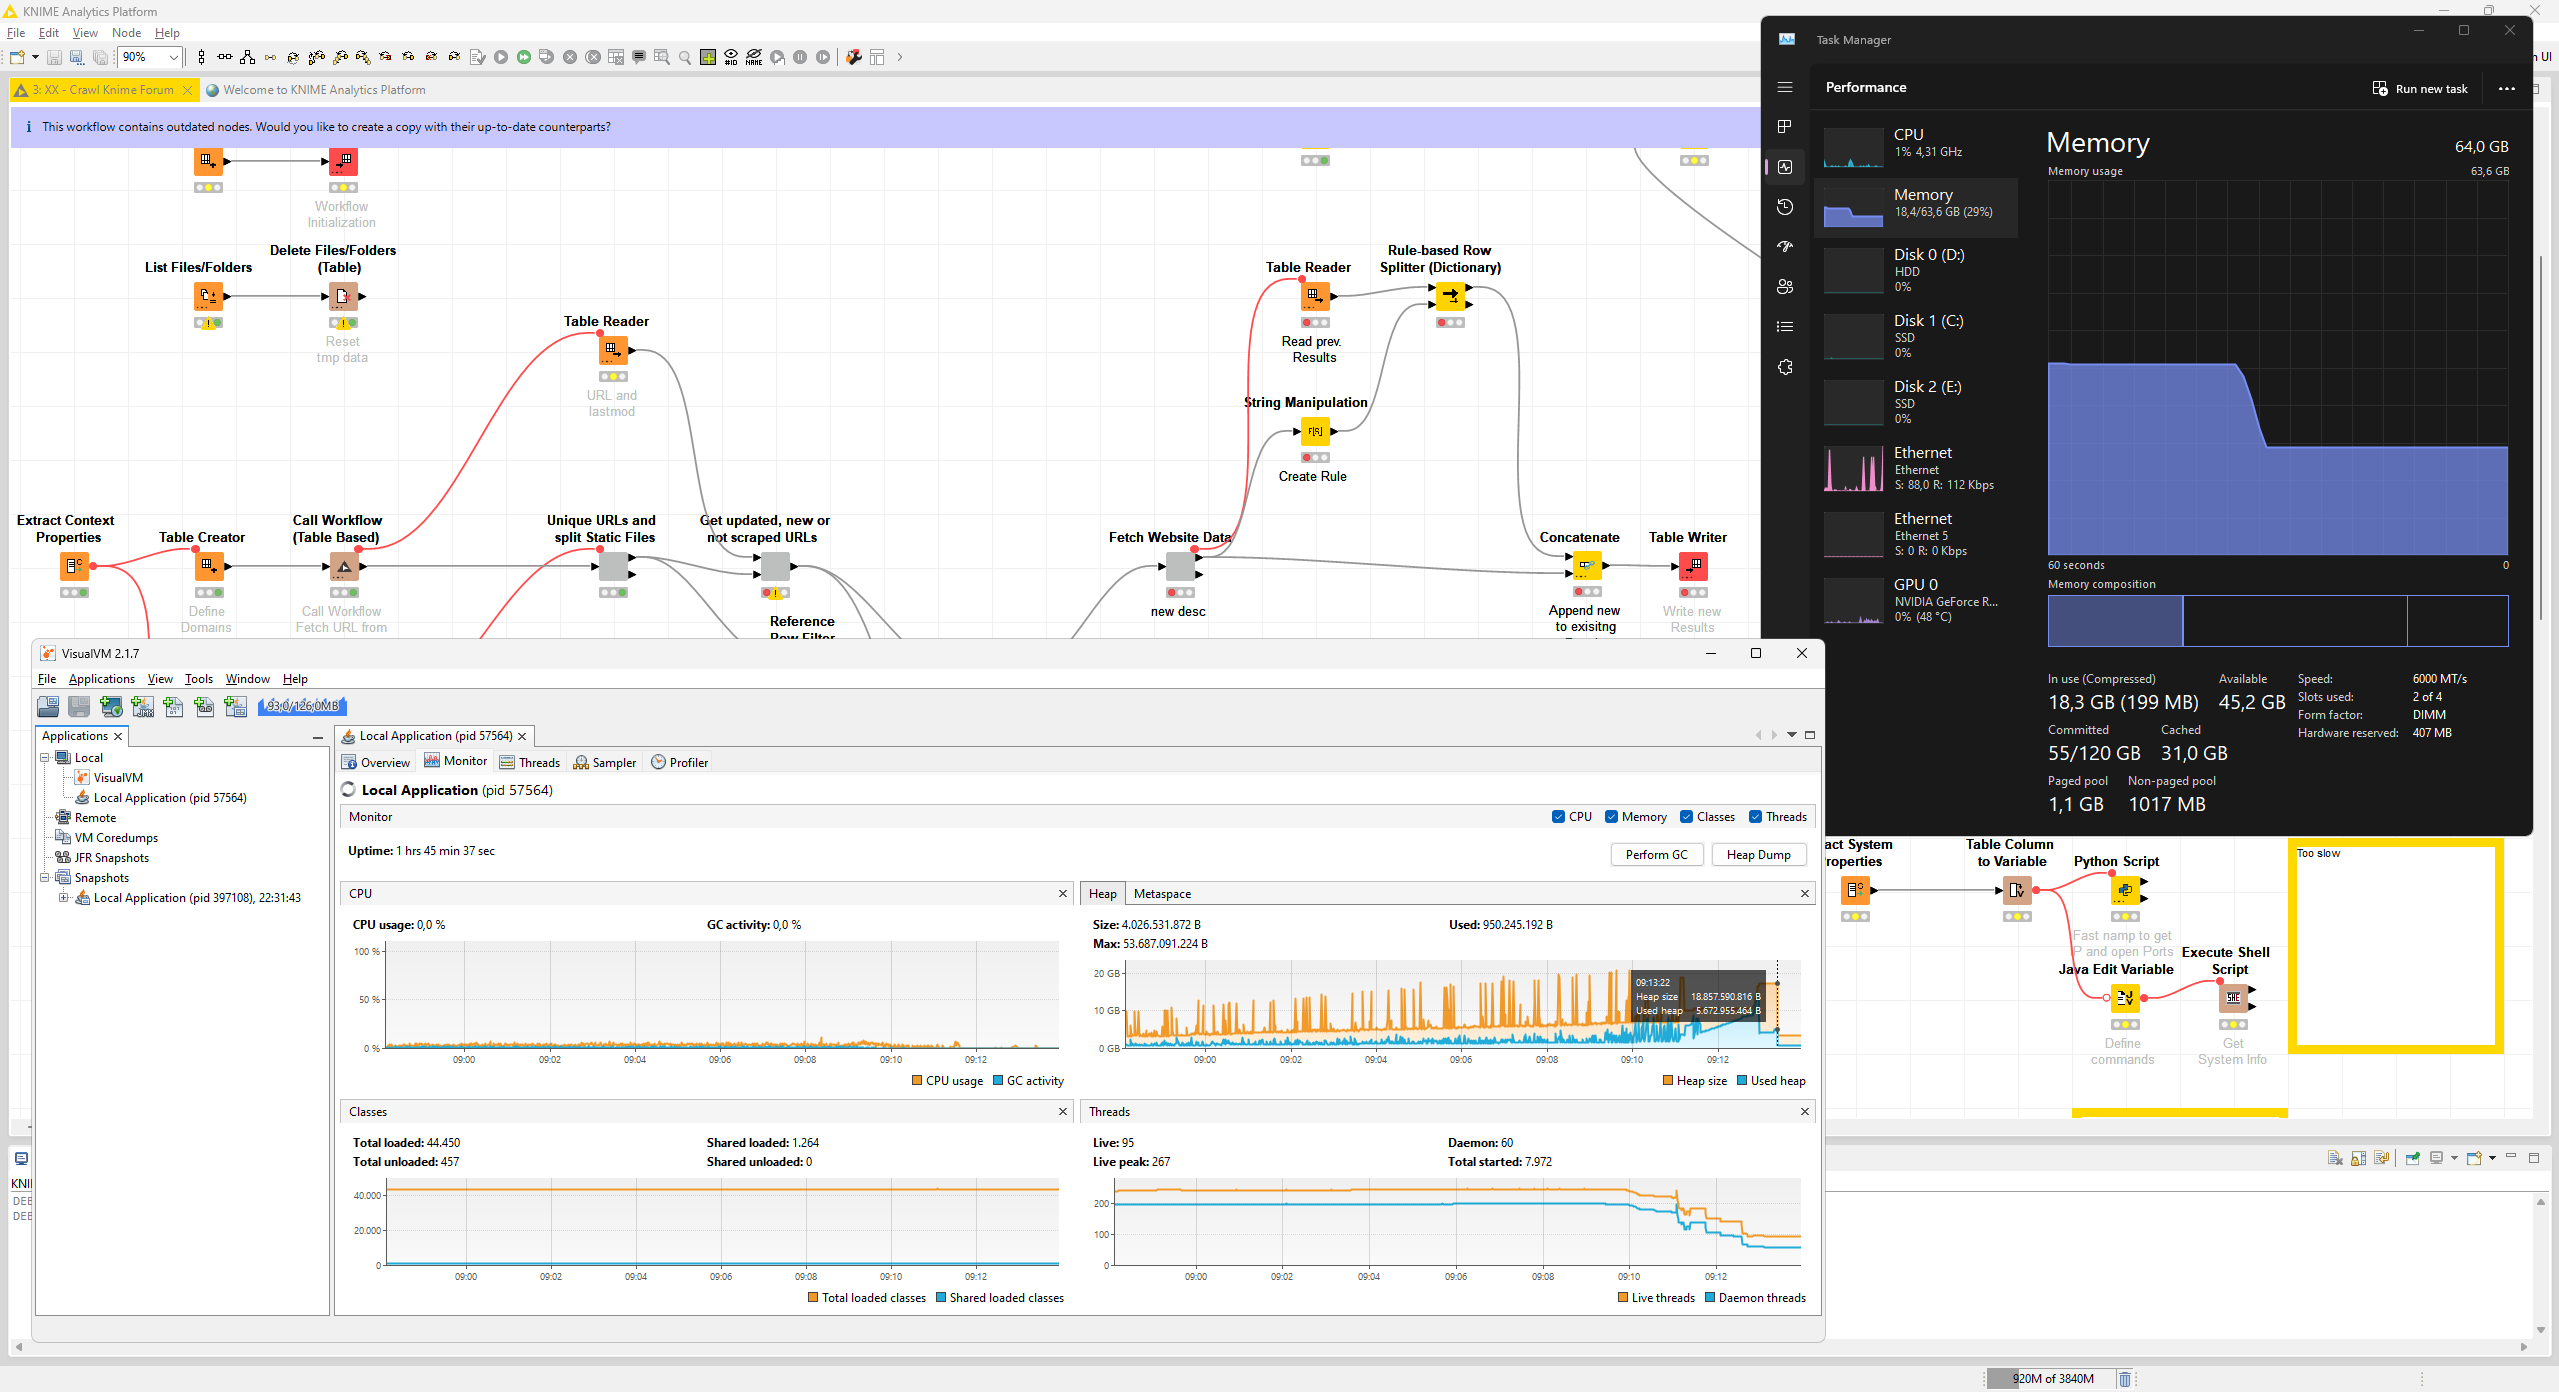
About the situation. I am scraping websites in 1k URLs per iteration and pay attention to the resource allocation. Sometimes I see huge spikes bringing my system close to the RAM Limit. If things fail, Knime goes white (unresponsive) and never recovers no matter if I free up resources by closing other apps or giving it time to recover.
Edit
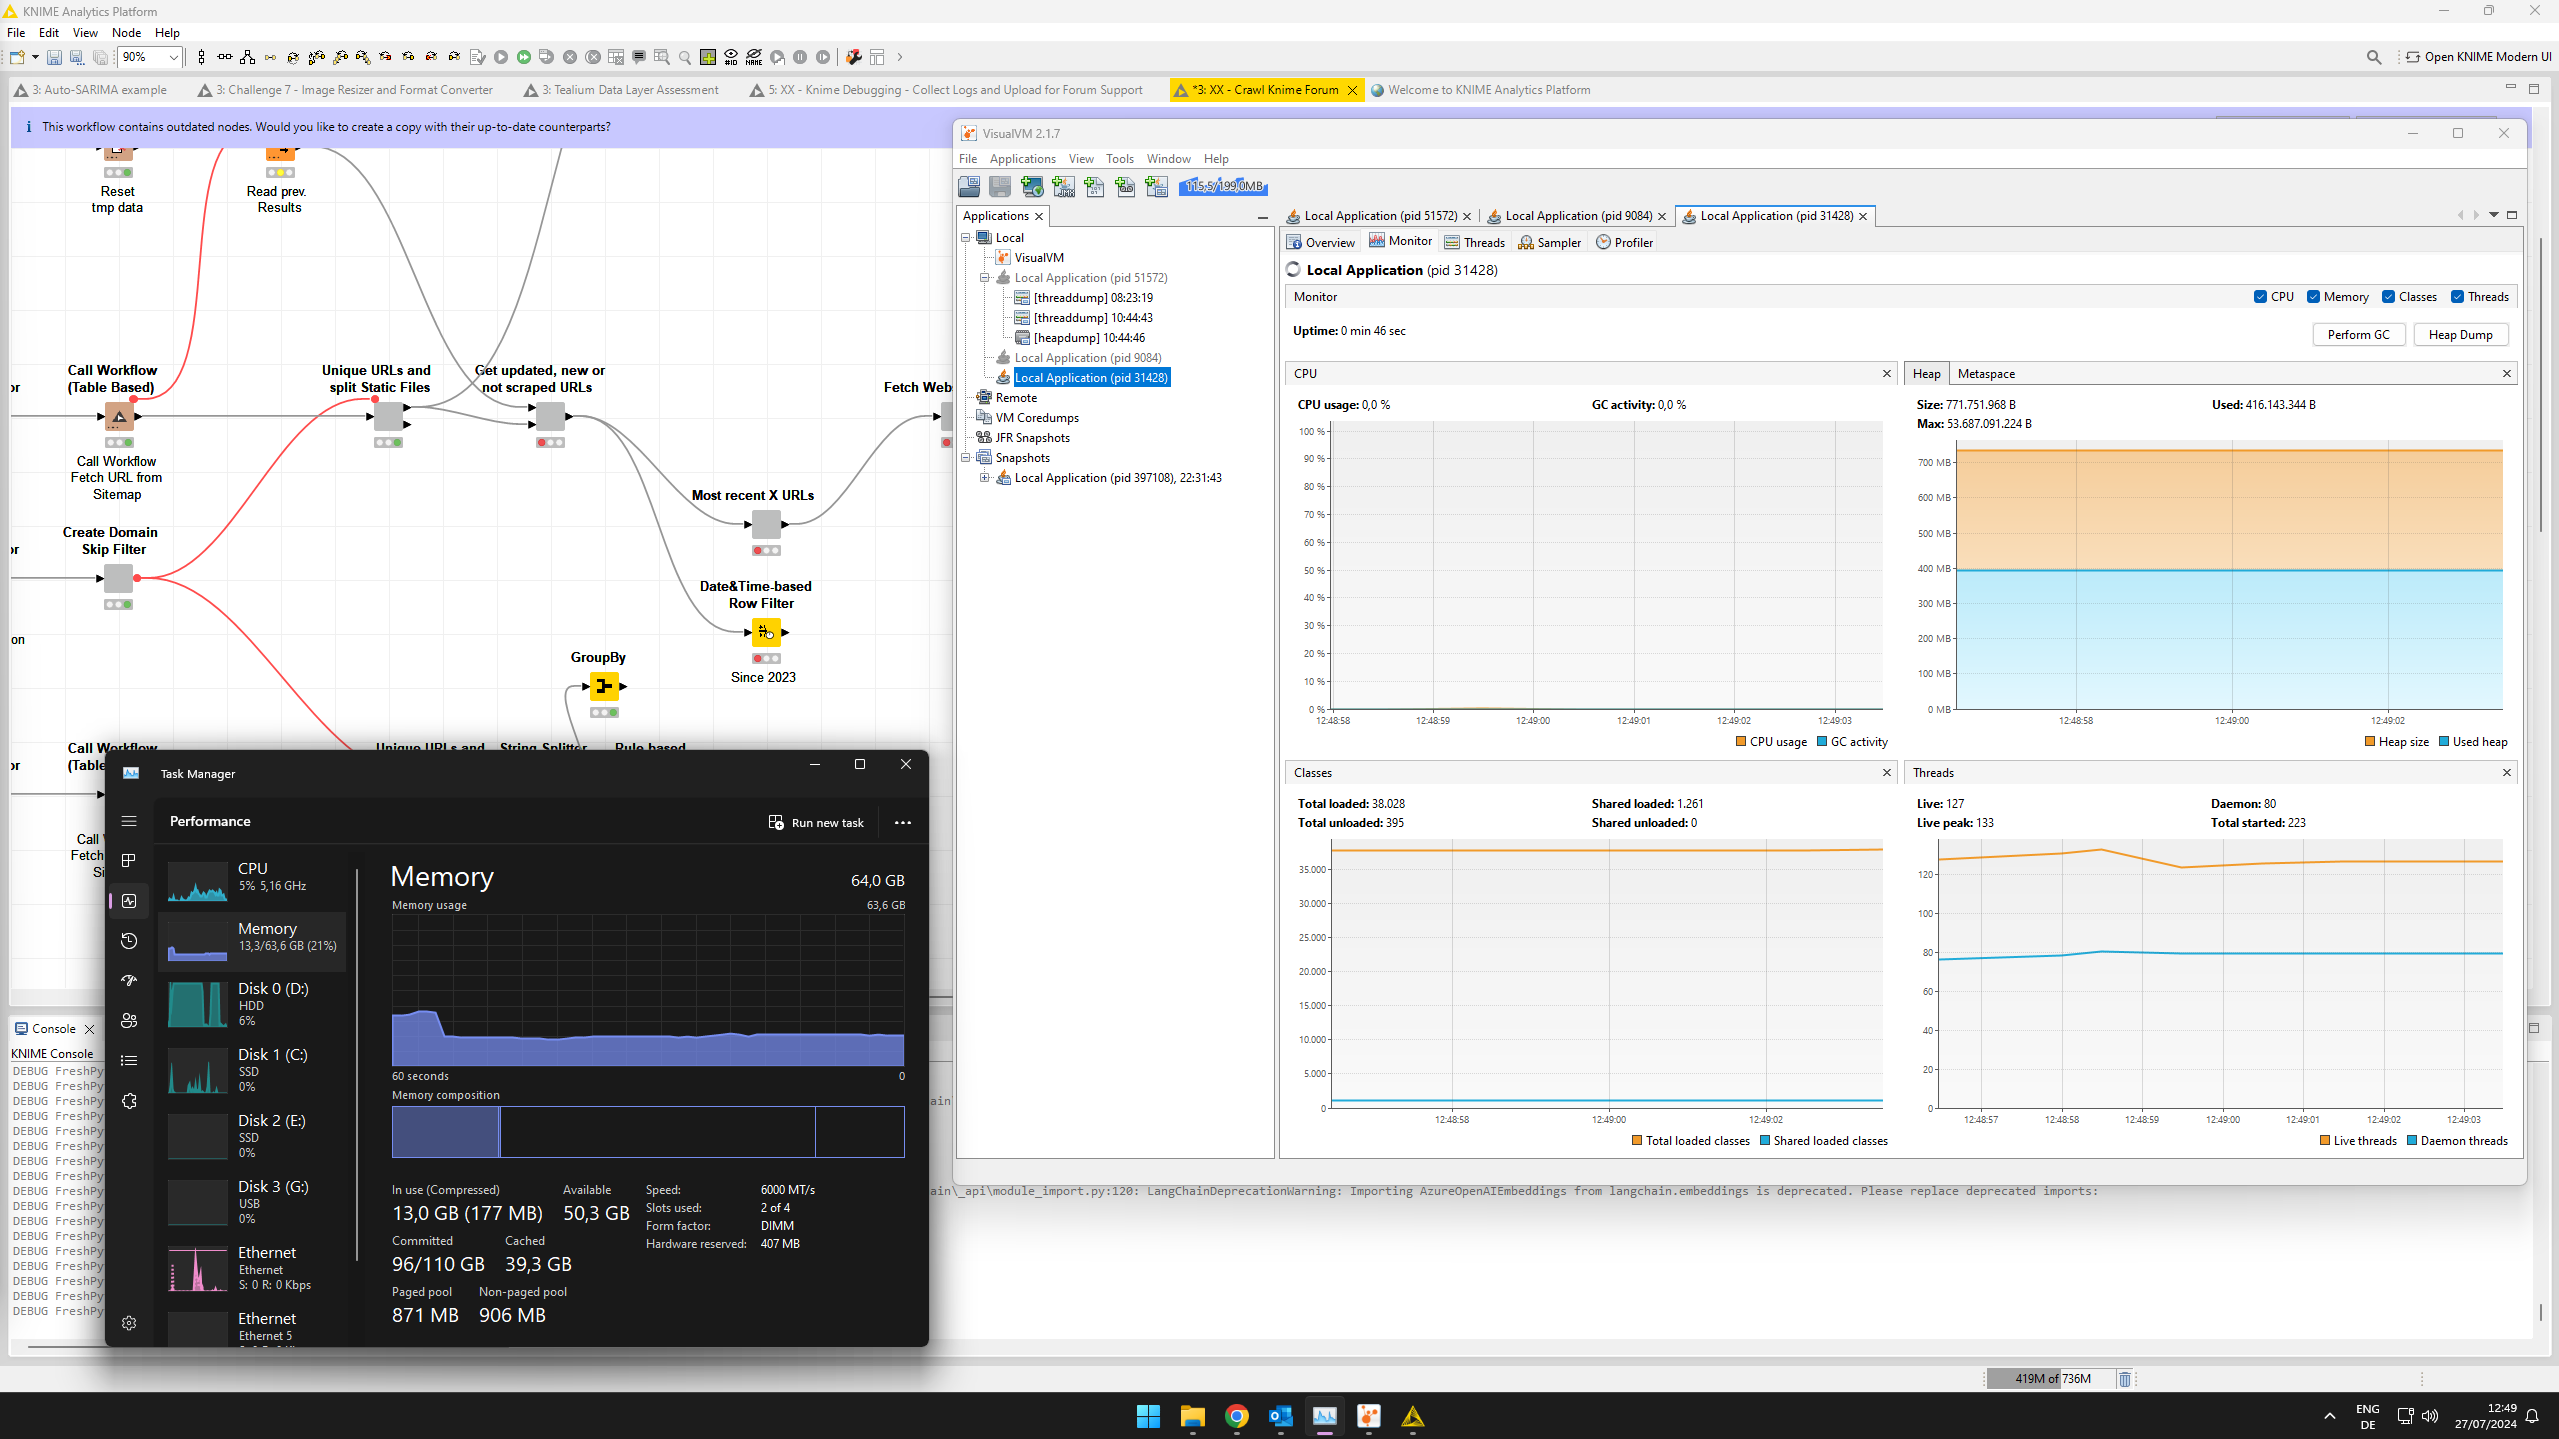
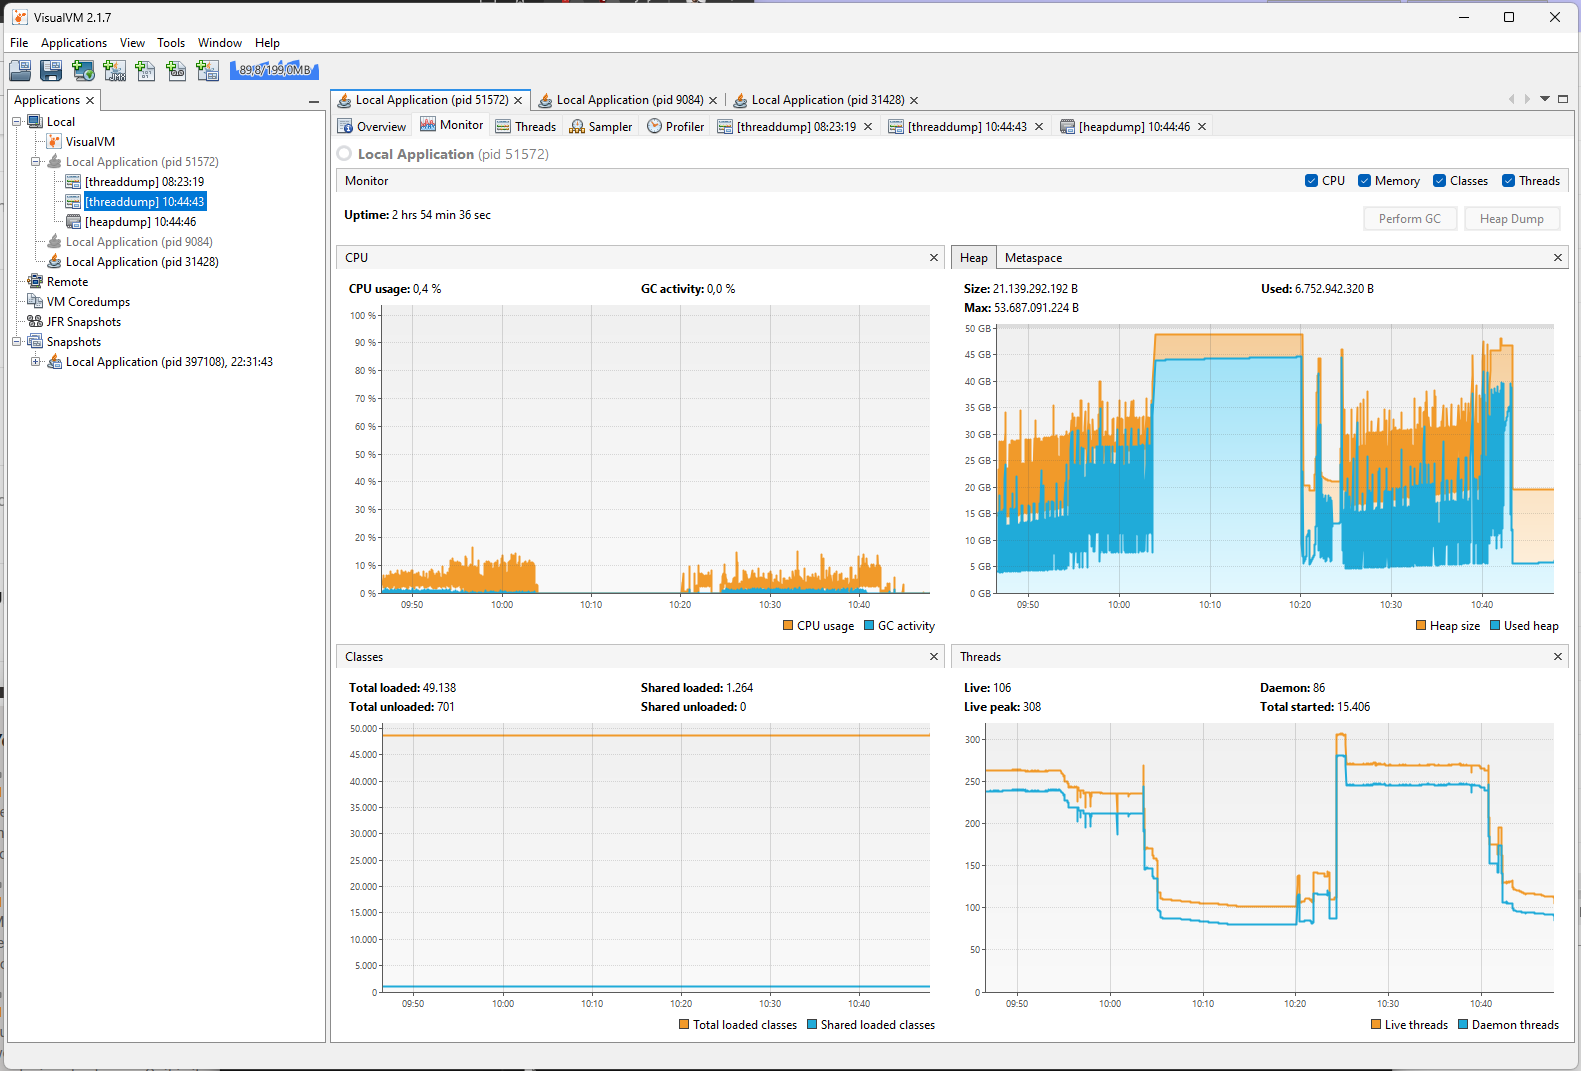
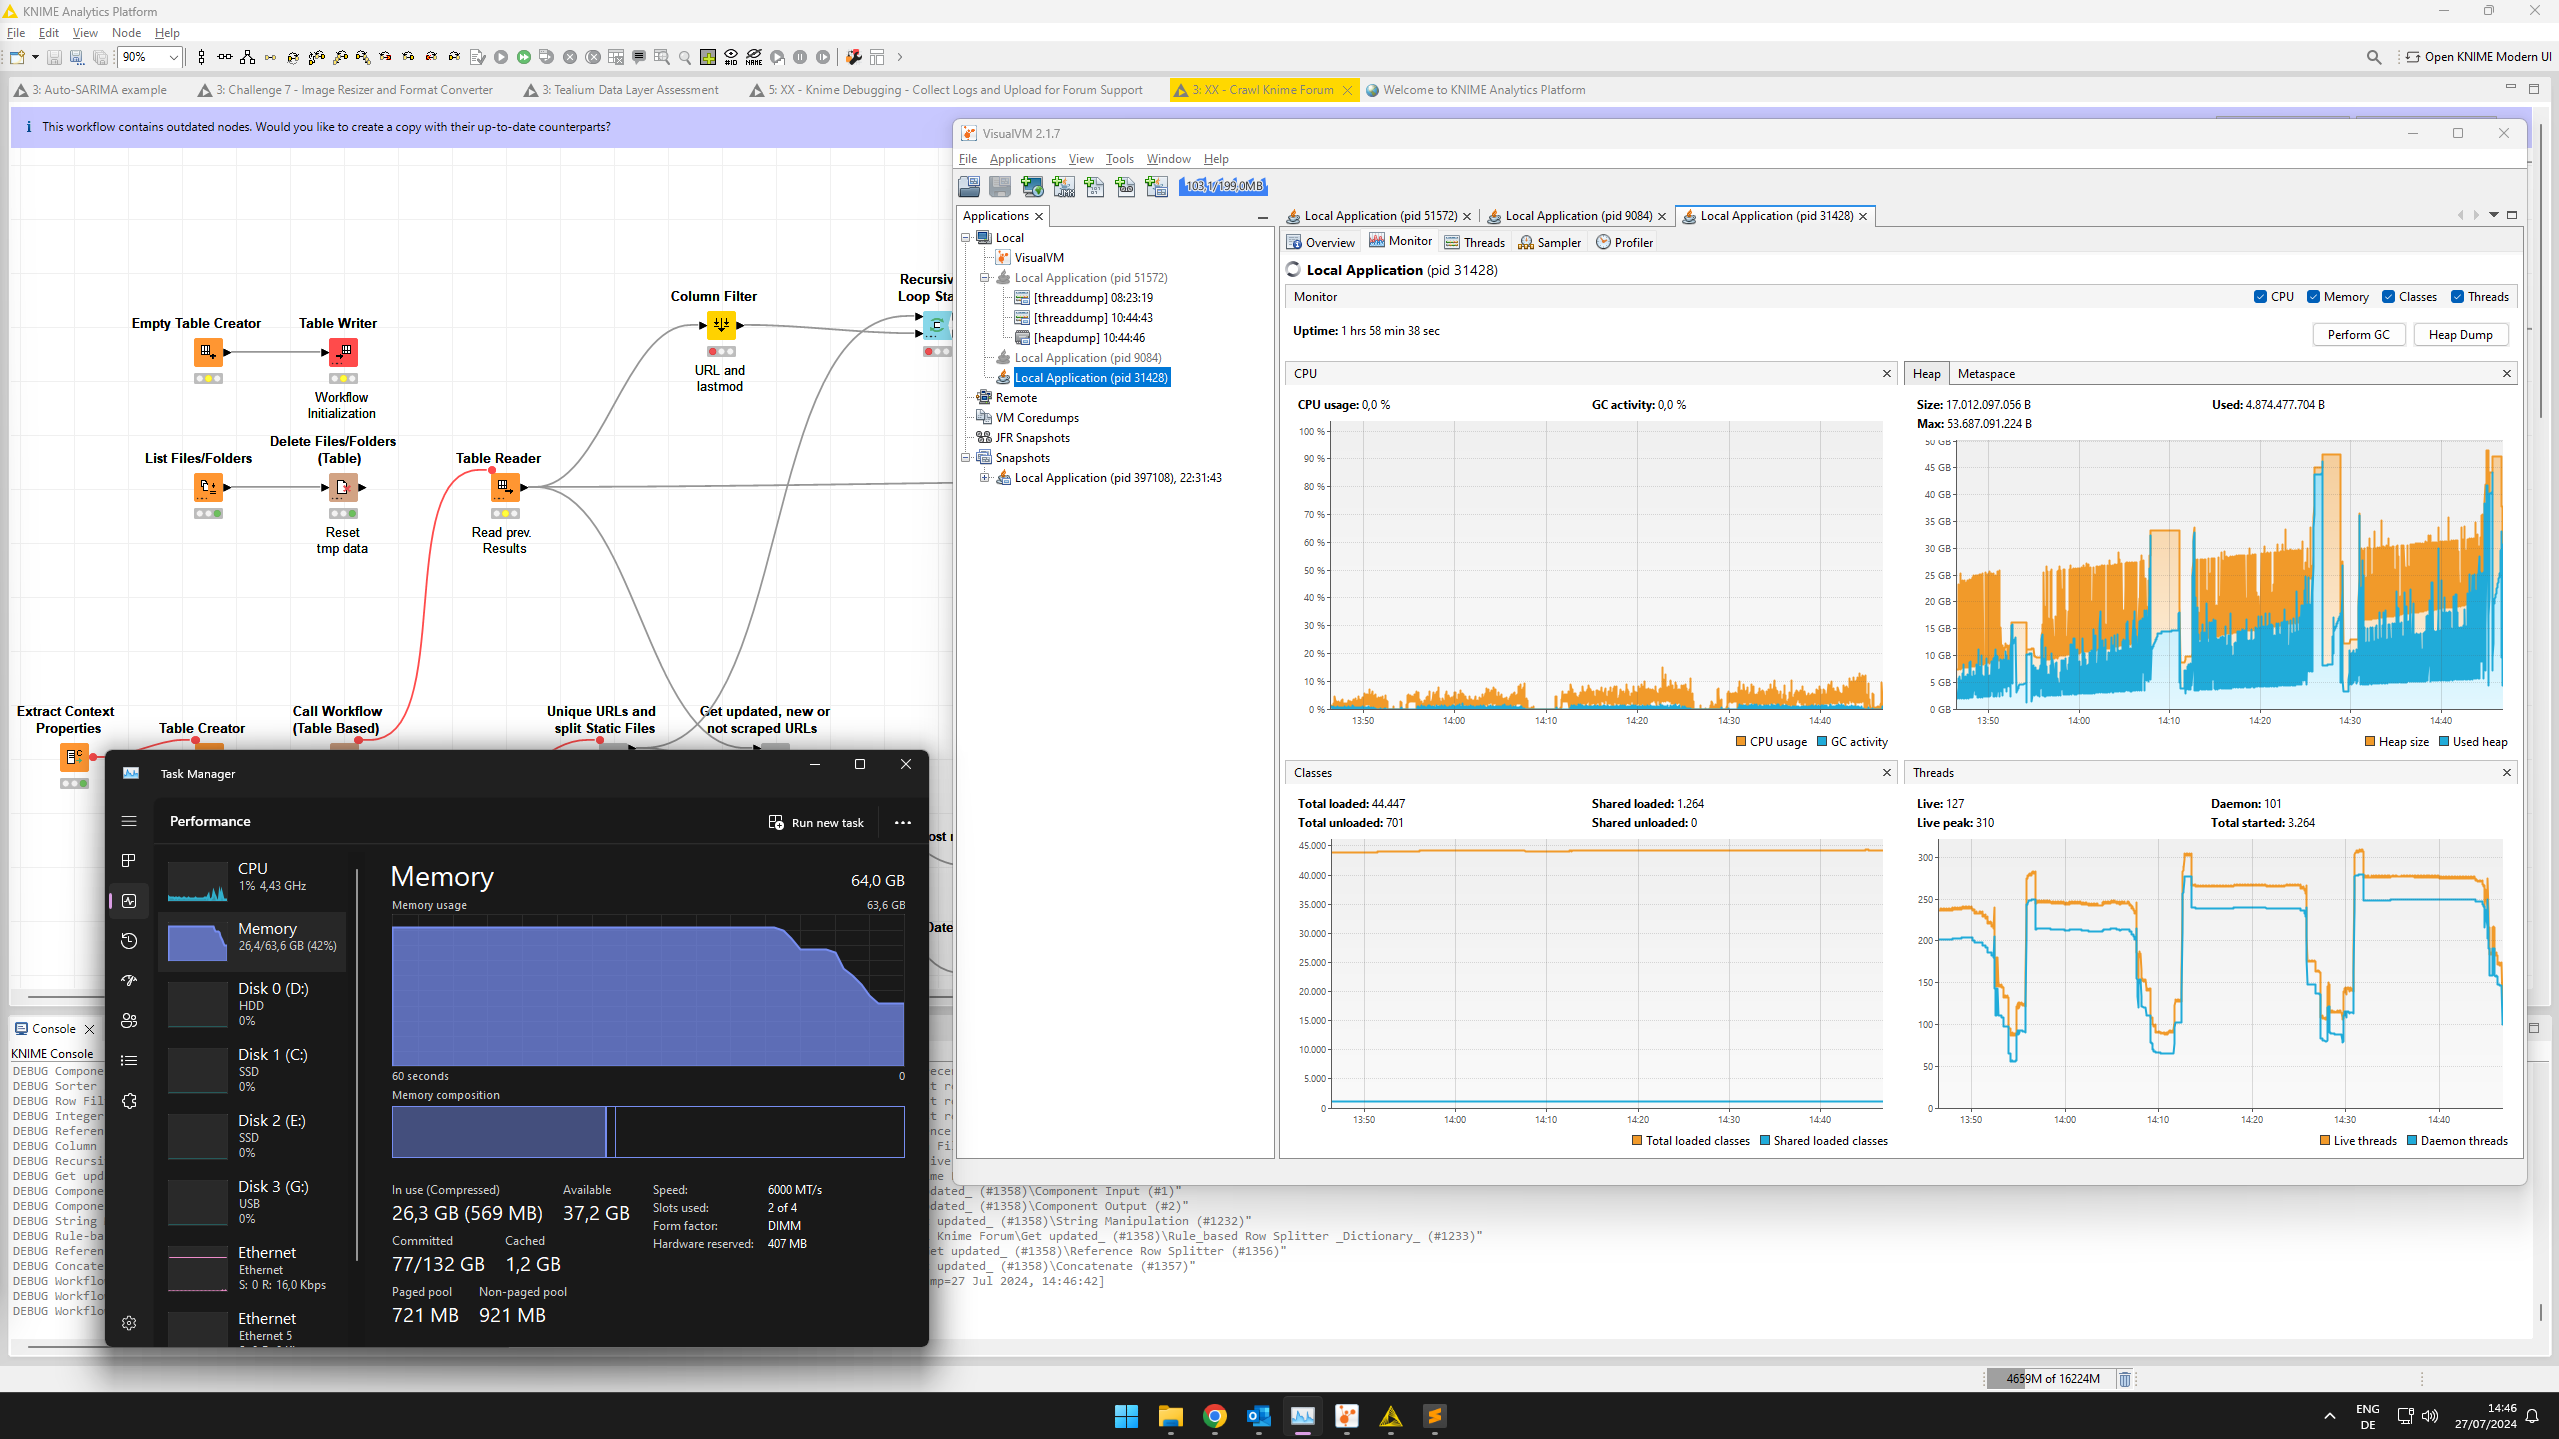
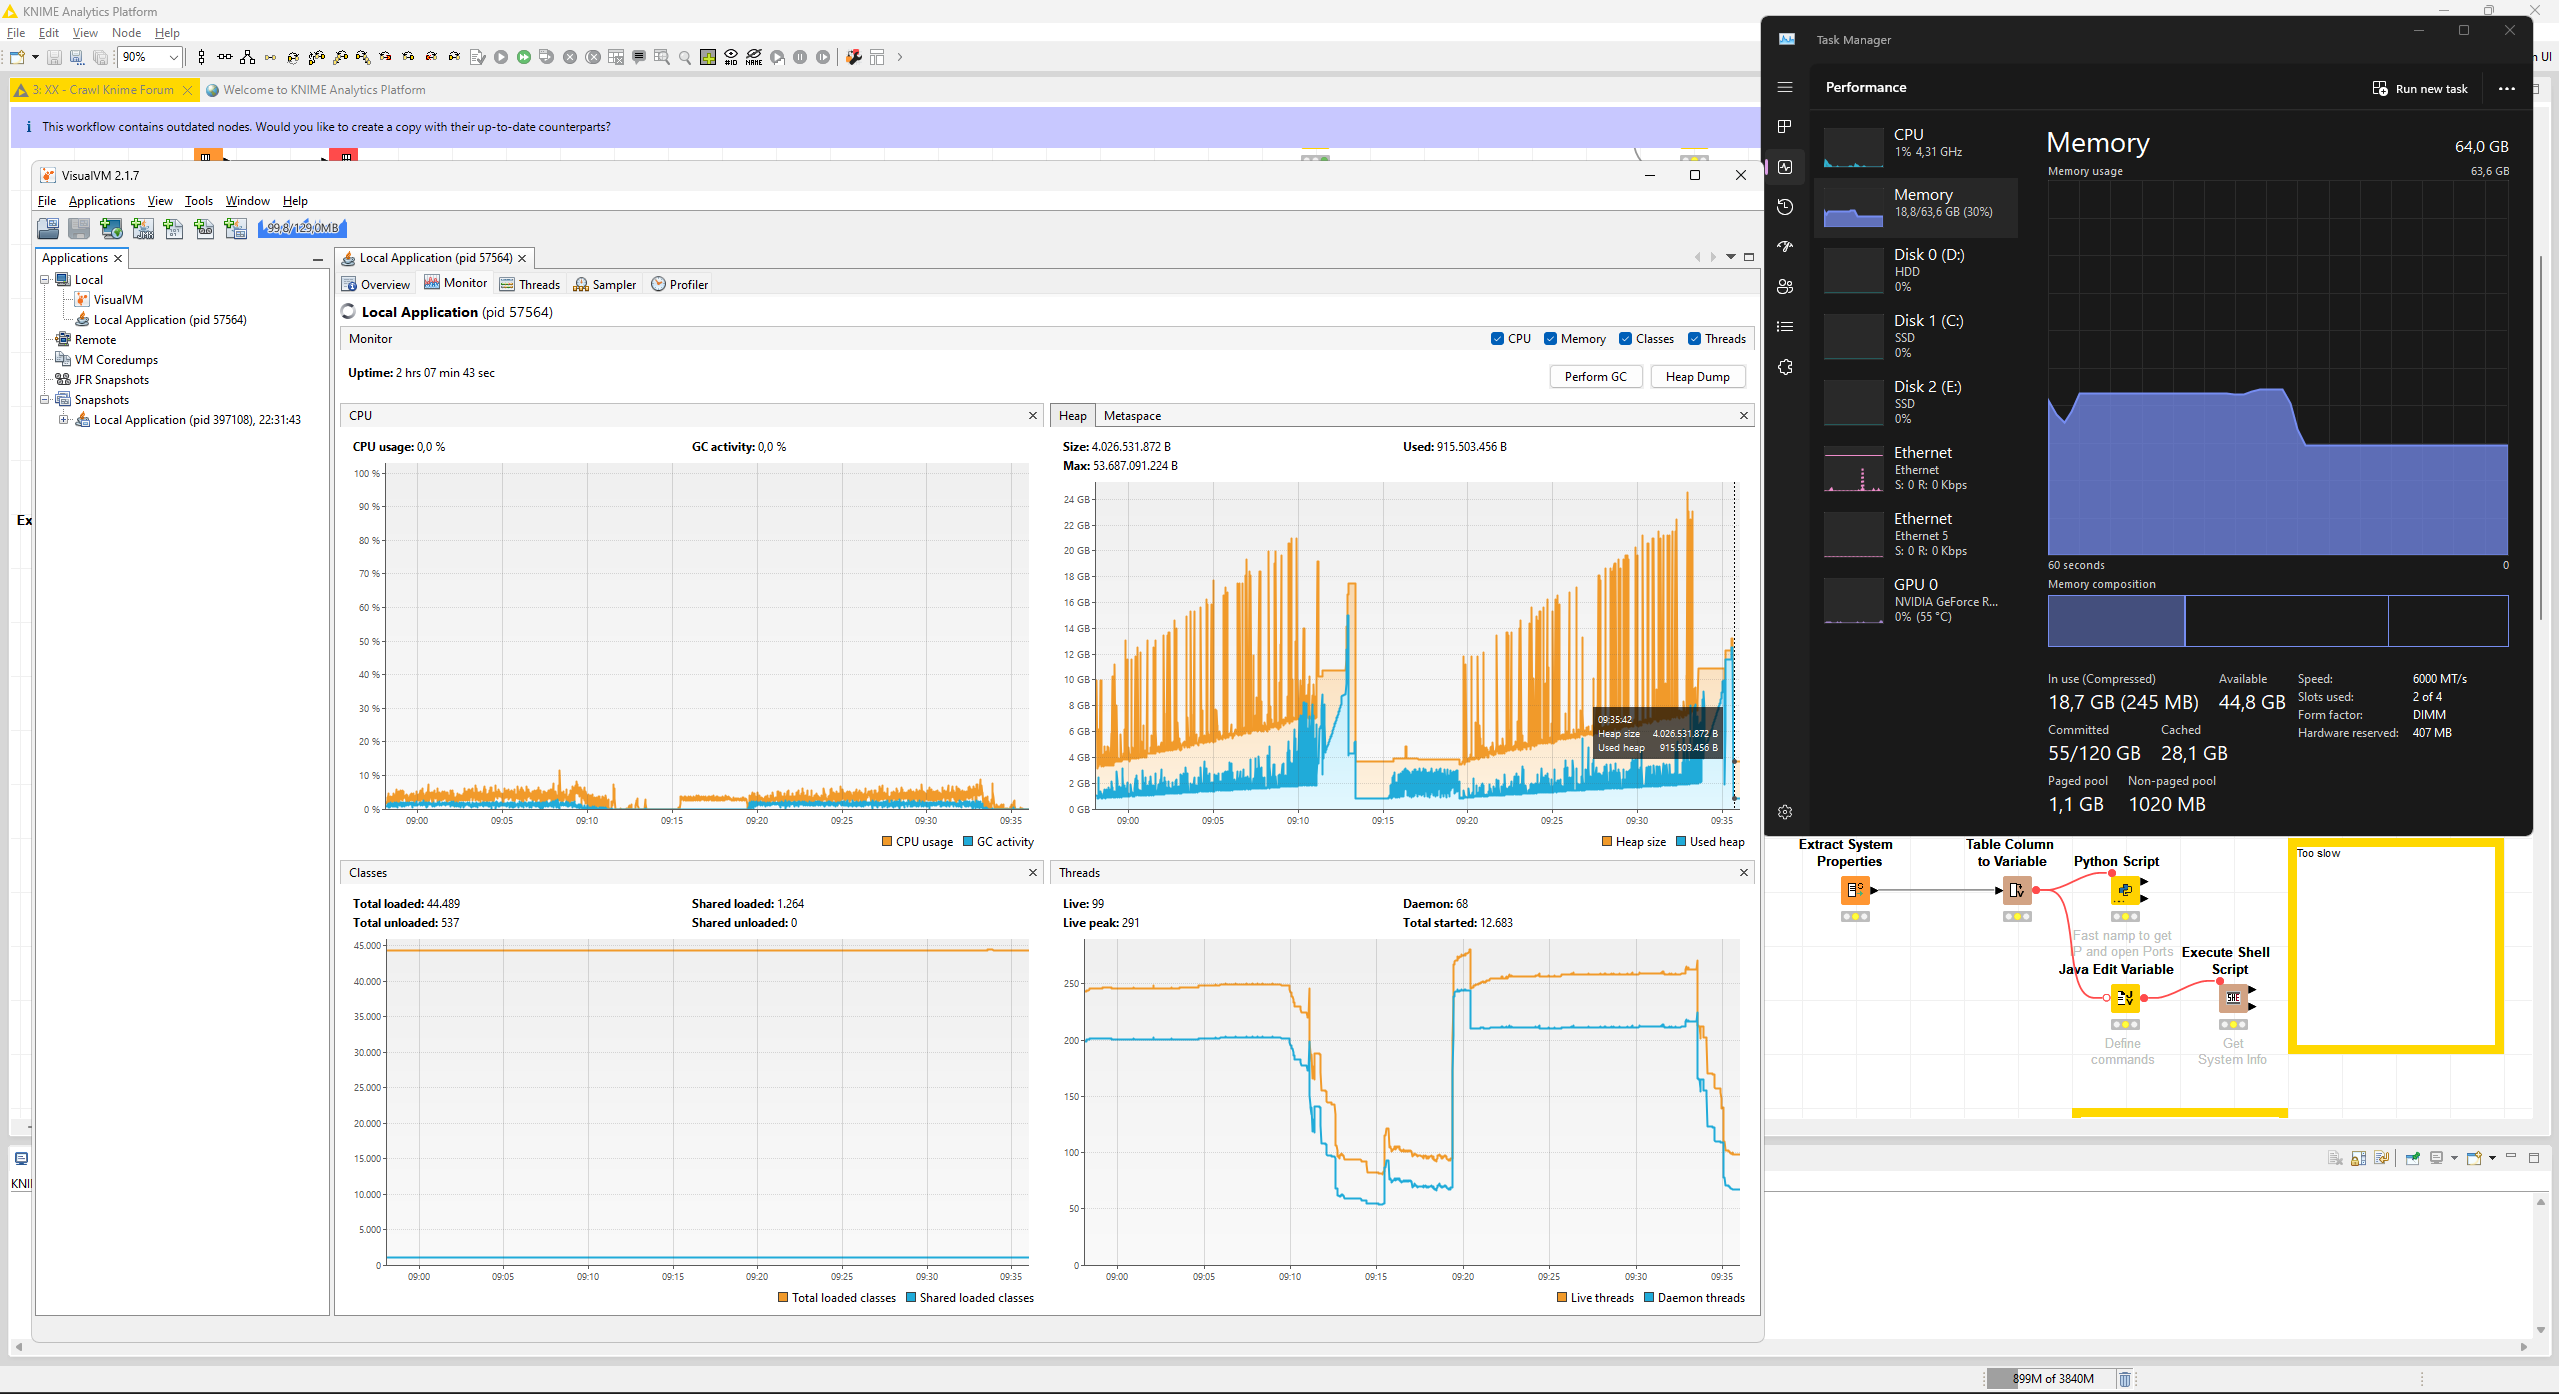
I ran the workflow four more times to provide a better example of ever increasing resource consumption regardless of garbage collection
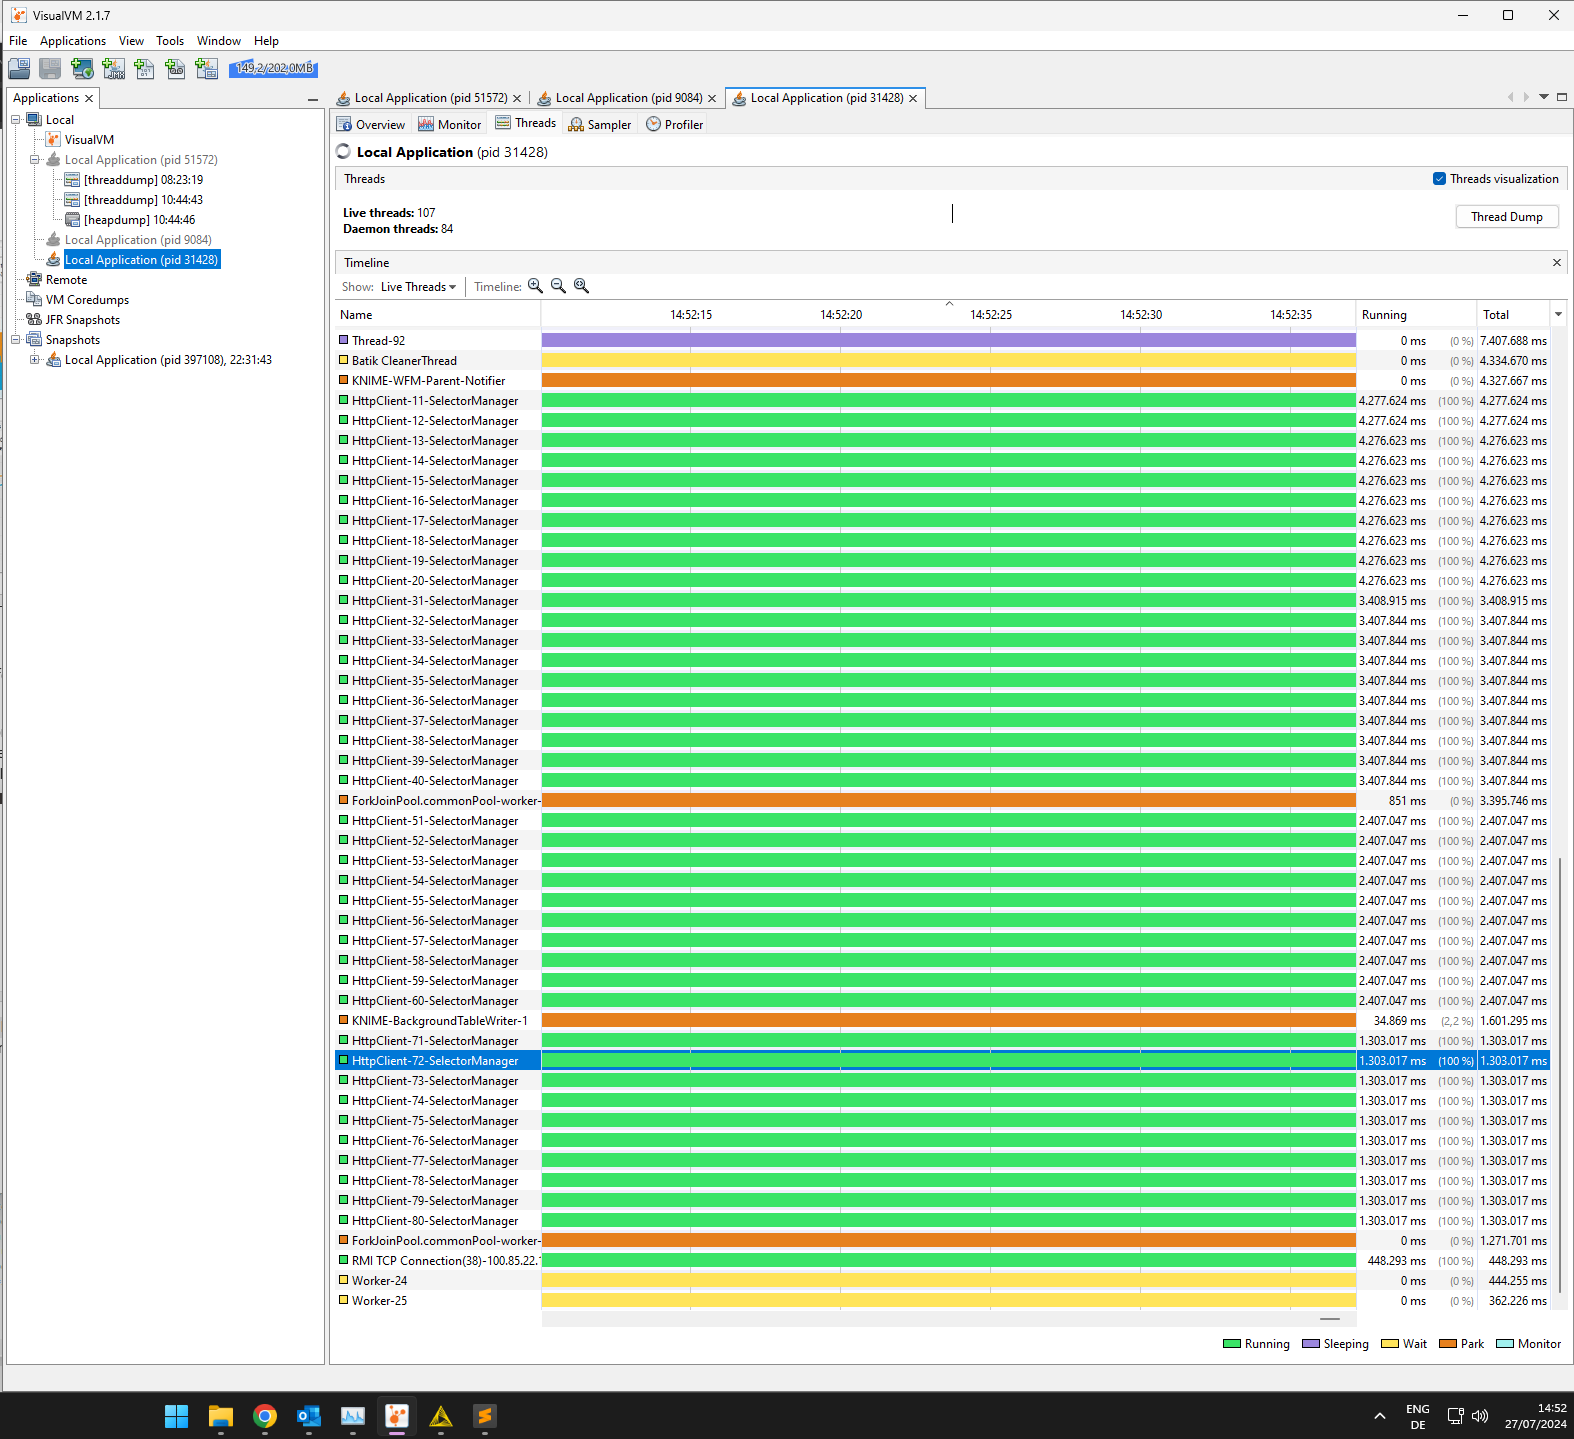
@qqilihq maybe unrelated but since the workflow uses Selenium I noticed, despite these nodes being reset, that there are still lots of http client threads running
I used the regular one as I run it several times anyway. Going to test with that one a few times.
Update
During execution
INFO  Run Garbage Collector 3:1126:0:899 Memory Status before GC:
INFO  Run Garbage Collector 3:1126:0:899 Free memory: 7620 MB
INFO  Run Garbage Collector 3:1126:0:899 Used memory: 23515 MB
INFO  Run Garbage Collector 3:1126:0:899 Allocated memory: 31136 MB
INFO  Run Garbage Collector 3:1126:0:899 Running Garbage Collection...
INFO  Run Garbage Collector 3:1126:0:899 Free memory: 21231 MB
INFO  Run Garbage Collector 3:1126:0:899 Used memory: 9952 MB
INFO  Run Garbage Collector 3:1126:0:899 Allocated memory: 31136 MB
INFO  Run Garbage Collector 3:1126:0:899 Max. available memory: 51200 MB
INFO  Run Garbage Collector 3:1126:0:899 Run Garbage Collector 3:1126:0:899 End execute (0 secs)
After execution, resetting nodes and running Heavy Garbage collection once more
INFO  Run Heavy Garbage Collector 3:1360     Memory Status before GC:
INFO  Run Heavy Garbage Collector 3:1360     Free memory: 23768 MB
INFO  Run Heavy Garbage Collector 3:1360     Used memory: 10375 MB
INFO  Run Heavy Garbage Collector 3:1360     Allocated memory: 34144 MB
INFO  Run Heavy Garbage Collector 3:1360     Running Garbage Collection...
INFO  Run Heavy Garbage Collector 3:1360     Free memory: 14097 MB
INFO  Run Heavy Garbage Collector 3:1360     Used memory: 5758 MB
INFO  Run Heavy Garbage Collector 3:1360     Allocated memory: 19840 MB
INFO  Run Heavy Garbage Collector 3:1360     Max. available memory: 51200 MB
INFO  Run Heavy Garbage Collector 3:1360     Run Heavy Garbage Collector 3:1360 End execute (2 secs)
Seems no change except that the continuous increase in resource consumption seems mitigated. Still got to test this thoroughly, I had only two test runs so far.
it might be that the SelectorManager threads you see die too slow for your web request rate.
We have had that problem in the past (in CXF 4 a default changed) and mitigated it for the code we control. It might be that the Selenium extension runs into the same issue now, where SelectorManager threads are created for each request and get shutdown too slowly (happy to provide more details and discuss).
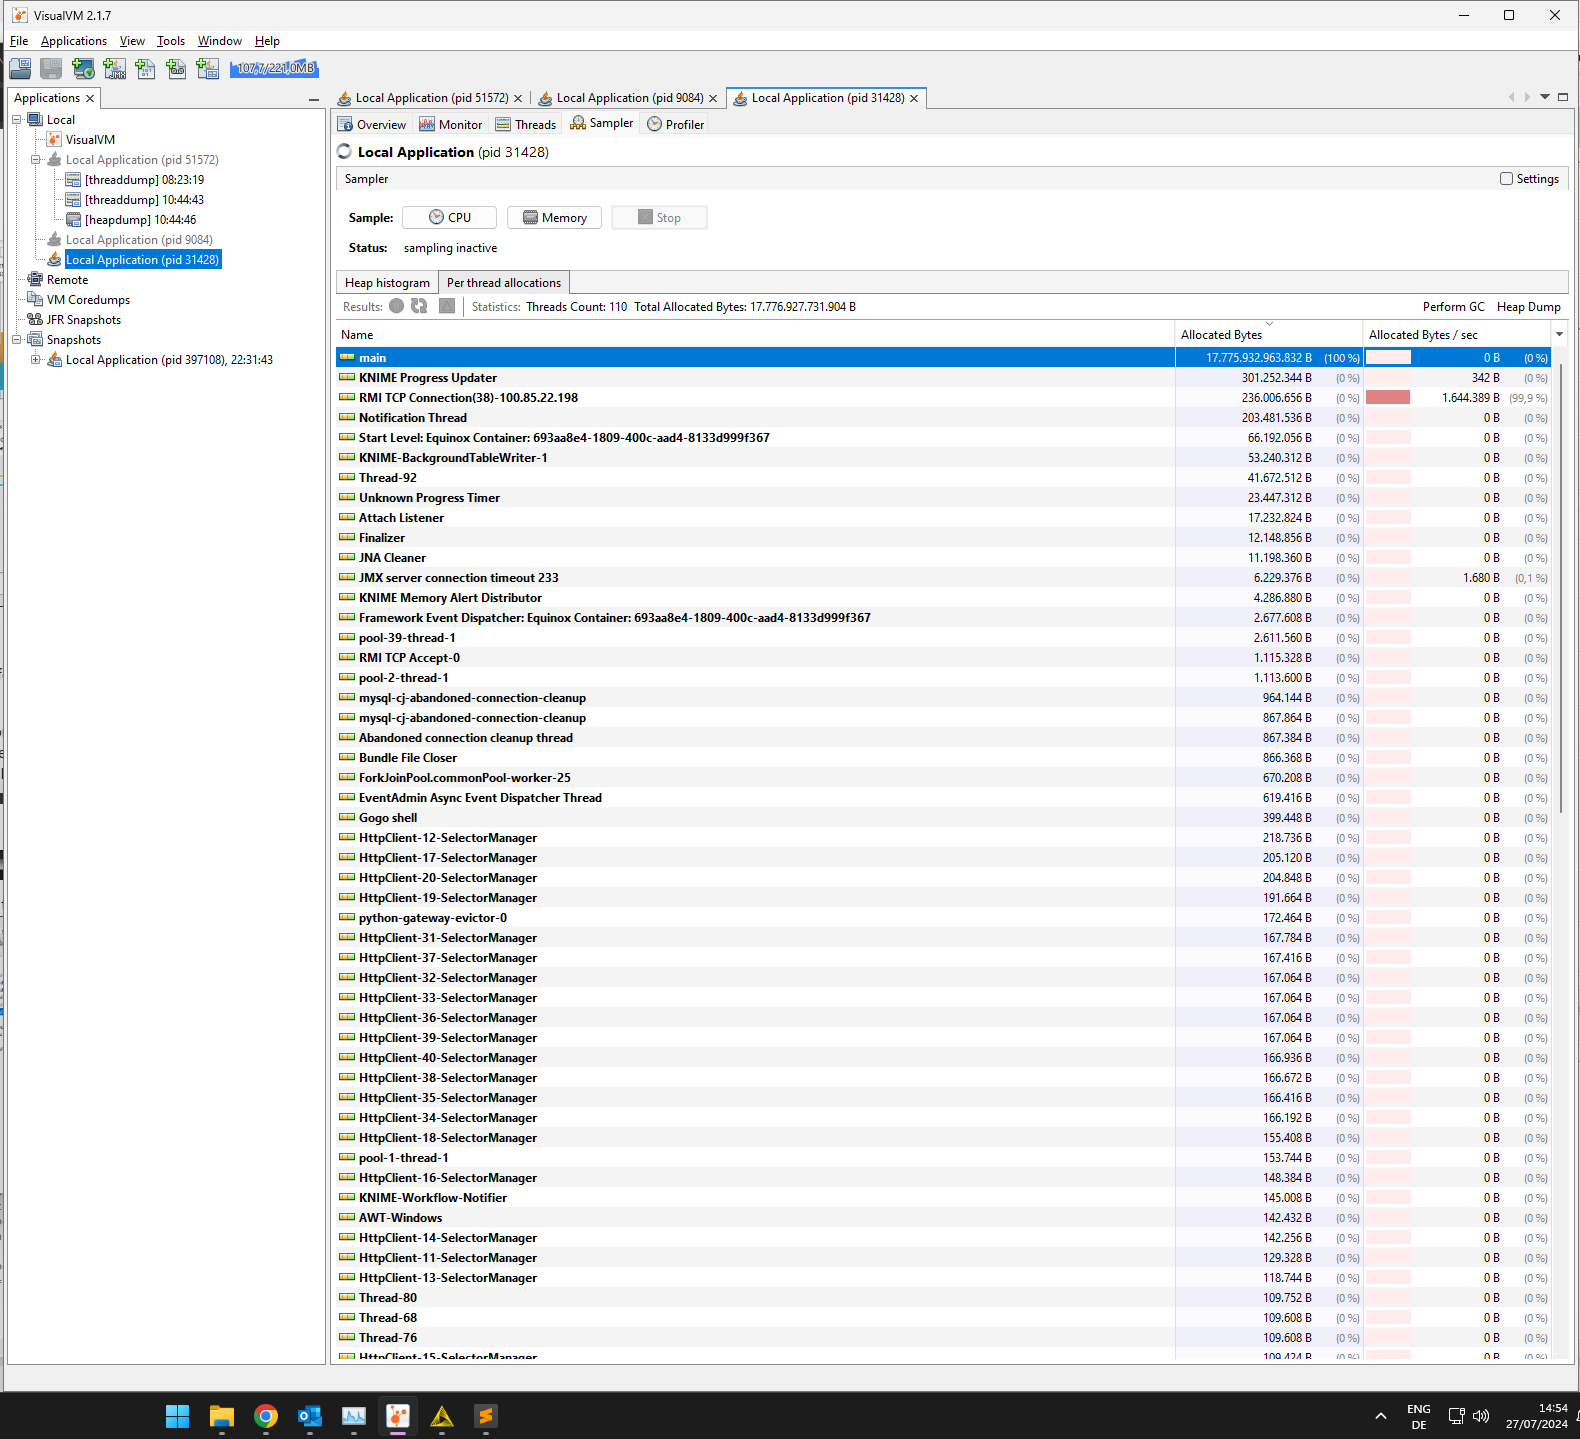
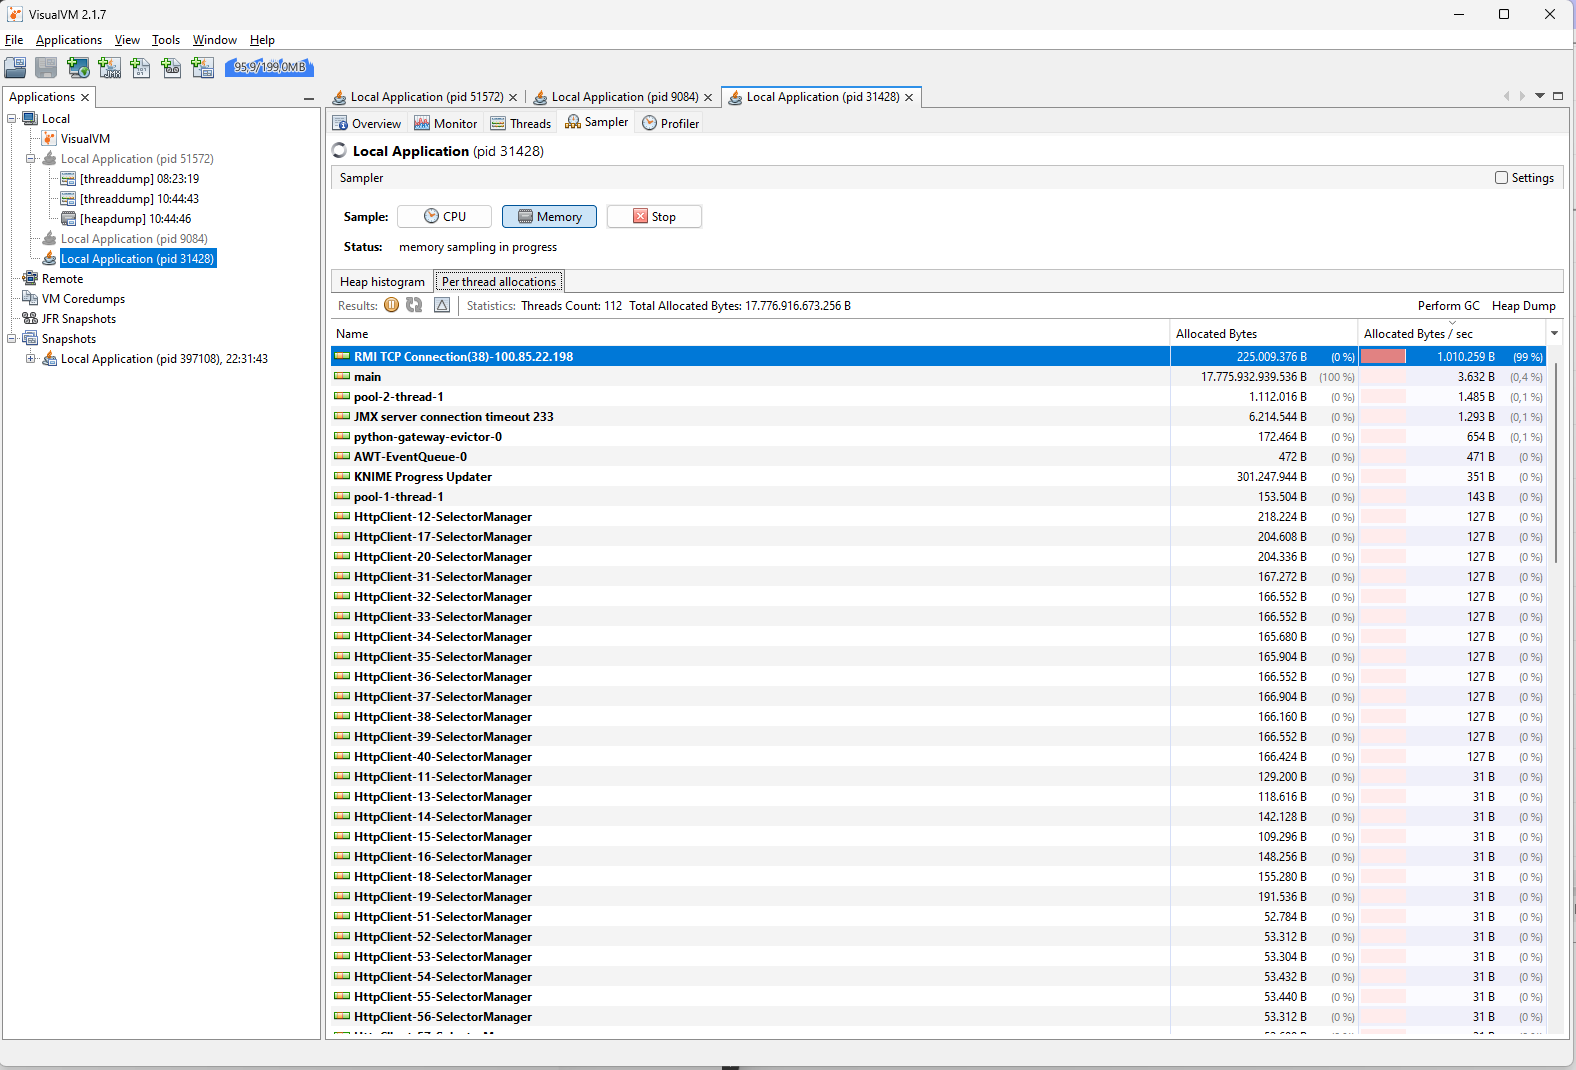
That you see main, KNIME Progress Updater, and RMI TCP Connection in the top three spots in the “Per thread allocations” total and by-time table is actually not unusual I think. main is the UI thread, displaying progress messages and KNIME Progress Updater constructs these messages (among others). Since your workflow seems to be large/long running, a lot of messages get created over time. This is why they are at the top of “Allocated Bytes” (in total, not currently) and “Allocated Bytes / sec”.
RMI TCP Connection is the thread supplying diagnostic info, e.g. for your open VisualVM. The bytes it allocates (and the huge allocation rate) are only allocated when you have VisualVM connected. So this seemingly huge chunk of memory allocation is an observation artifact.
What would help to diagnose this further would be a look at the Heap histogram in the neighboring tab, or a full heap dump (but this is probably ~30GB currently for you so somewhat harder to share I guess). I am also a bit surprised that the Classic UI heap diagram shows only 4GB used of 16 GB current heap… what is your Xmx setting and do you use the columnar backend or Python nodes?
I believe so too because when I call a remote workflow the Chrome session prevails for quite some time even though the main workflow already started processing nodes way down the stream.
The parallel chunk nodes might further worsen the issue because the branches getting discarded while, just pure suspicion atm, the wed driver is still running.
Xmx is s et to 50g. I have a heap dump of about 6.2 GB, created I believe after garbage collection to allow analyzing what’s still allocated. I will upload it. Can you DM me so I can share the link to you in private?
I will also do a few more test runs to check the heap histogram. Also thanks for the other details. They will become handy when I start debugging the issue about elevated CPU usage just by connecting to the Hub which I raised during 5.3 hacking days.
@mwiegand I think the garbage collection itself will also require resources and create some overhead so maybe use that with a level of caution and at a central fork not after every loop.
What I also found was that sometimes in complex workflows a well placed cache node before a new breaking point (API calls, database operations etc) outside KNIME helps stabilizing the workflow.
Also after some operation a few seconds of wait might give a system a chance to collect itself so to speak.
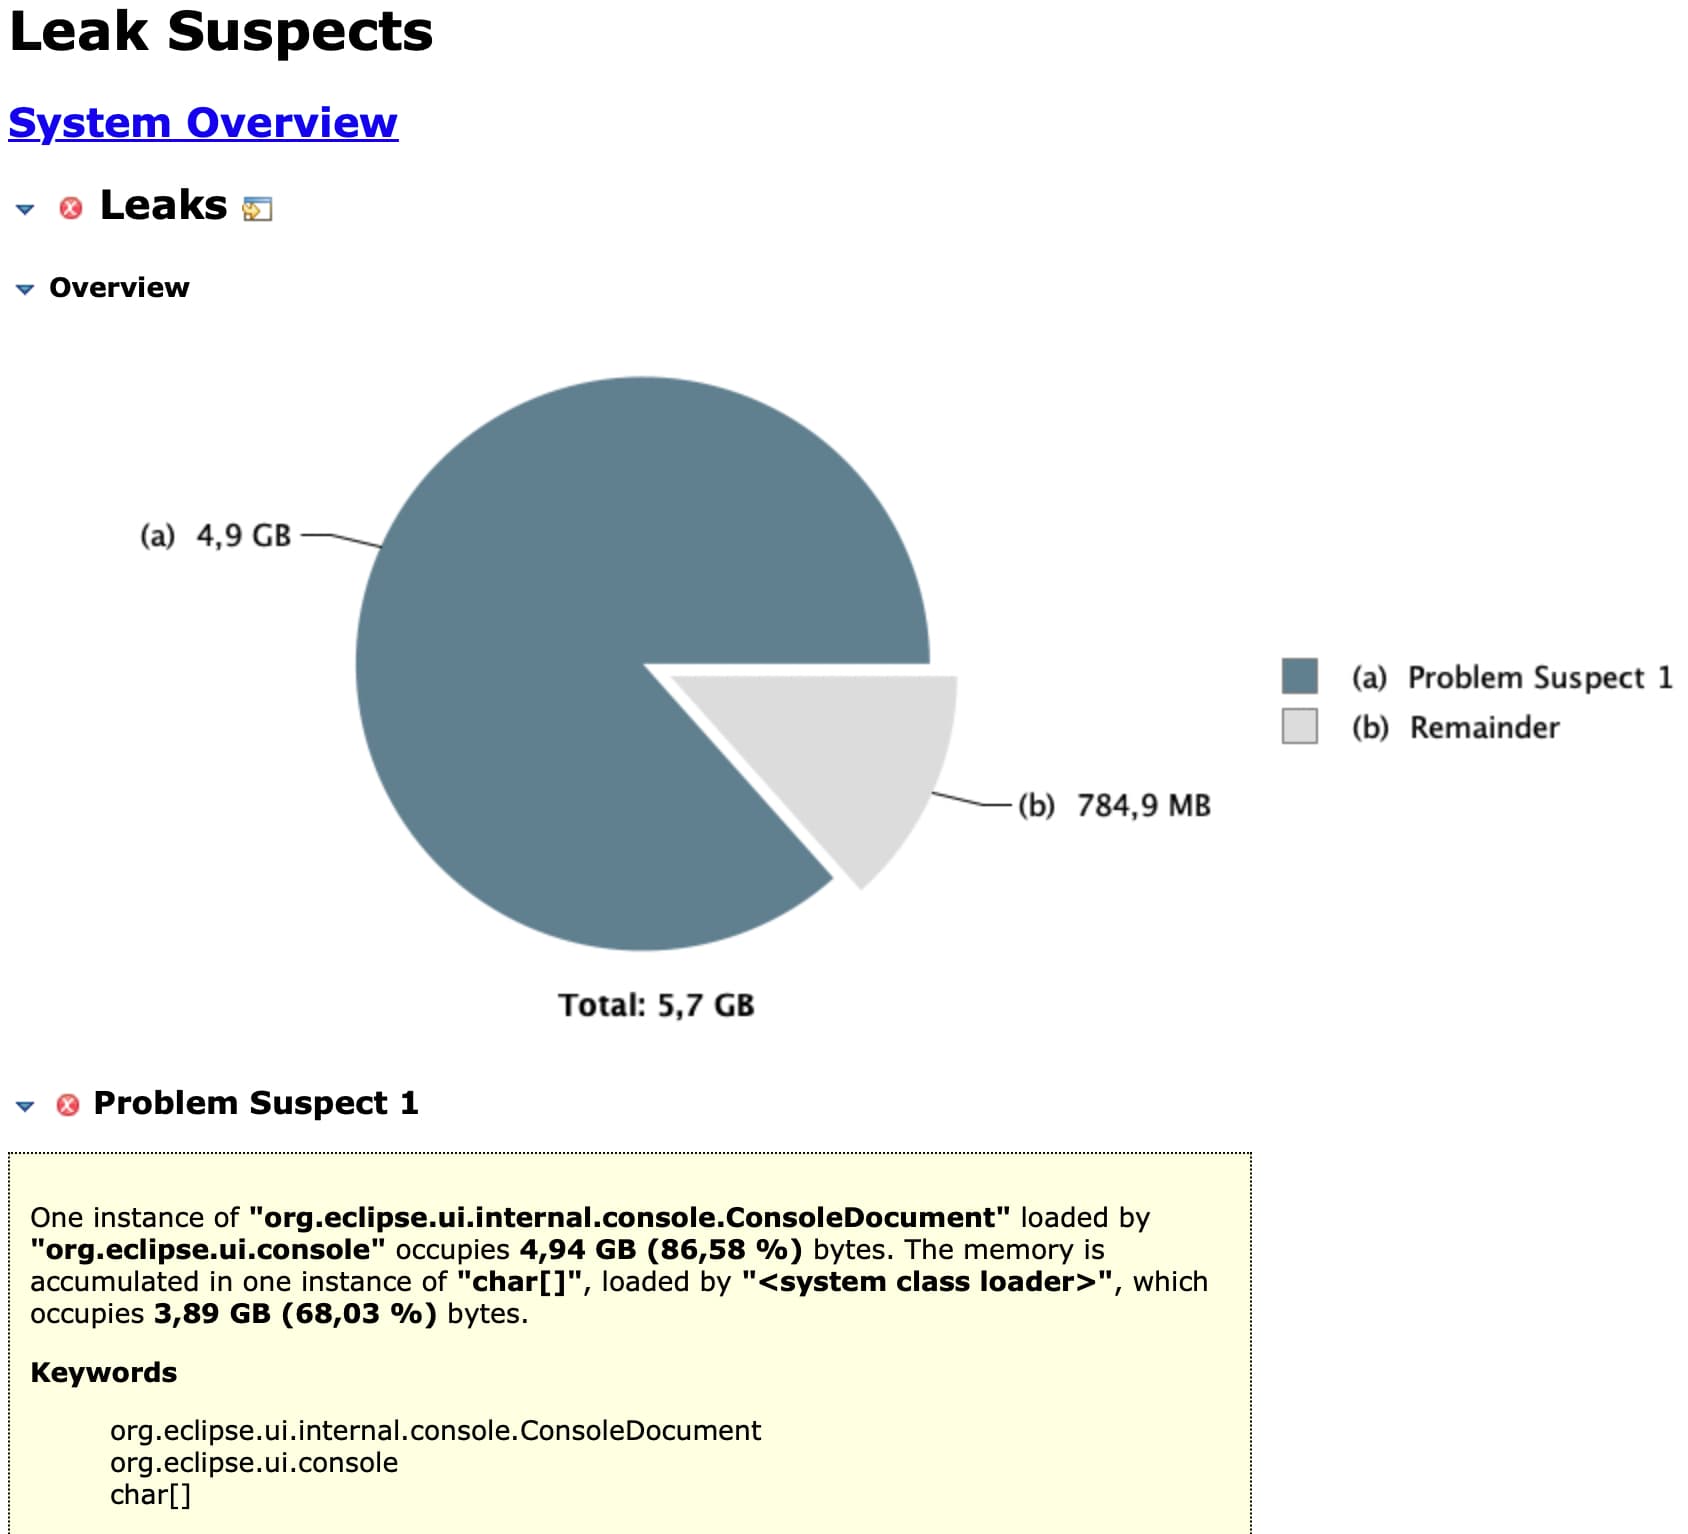
Eclipse itself usually has a “keep only last X messages” setting, but I don’t think we have that in KNIME. So I suspect your Console view is keeping these messages alive.
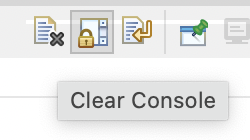
The view has a “clear” option (left-most button):
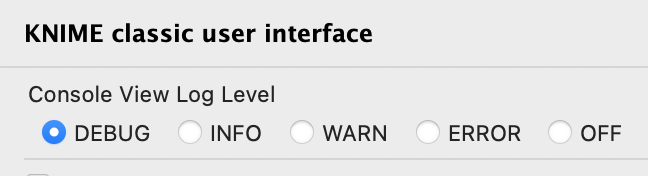
After clicking it and letting garbage be collected with the Trash bin button in the Heap status bar, the memory consumption should go down significantly. To avoid messages from piling up, it may be a good idea to set the Console log level to WARNING or even ERROR when executing this workflow. The log4j config can also be used to fine-tune which Java packages are even logged (to the Console and logfile), so you could also configure that, but I think this is not that straight-forward as temporarily setting everything to ERROR for the Console.
I’d never have thought, though, to some extend it makes sense, that log messages end up both in the log written to disk and remain in the head space. The debug level, which I kept active after the community hacking days, is set on purpose to continue providing elevated level of support.
Though, the scenario is still valid to some degree for regular users in case a workflow runs for long times as it unnecessarily consumed resources. Adding an config option in the garbage collection node or clear that data by default, given the redundancy to the logs written to disk, or maybe lazy loading prev. logs or, like in Chrome filtering by verbosity, would certainly be nice.
PS: I enabled to log into the workflow directory. the knime.log is therefore not found in the apps sub folder “configuration”. I could not find the log4j config file. Can you assist please?
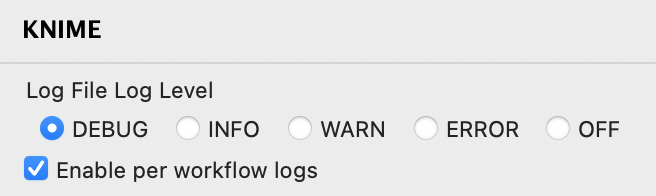
The Console and Log File (aka knime.log, which is always located in the workspace and accessible via ModernUI menu “Show KNIME Log in File Explorer”) are configured separately. Both can be configured in the Preferences (log level only) and in the log4j3.xml file (which is next to the knime.log). So you can set the Console to, e.g. ERROR, in the Preferences and leave the Log File level on DEBUG. Then, when you need to provide more info, you can retrieve it from the knime.log (or send it). This way, your Console view does not blow up your heap space but you can still access debug information from disk.
This should reduce the needed heap space for your workflow:
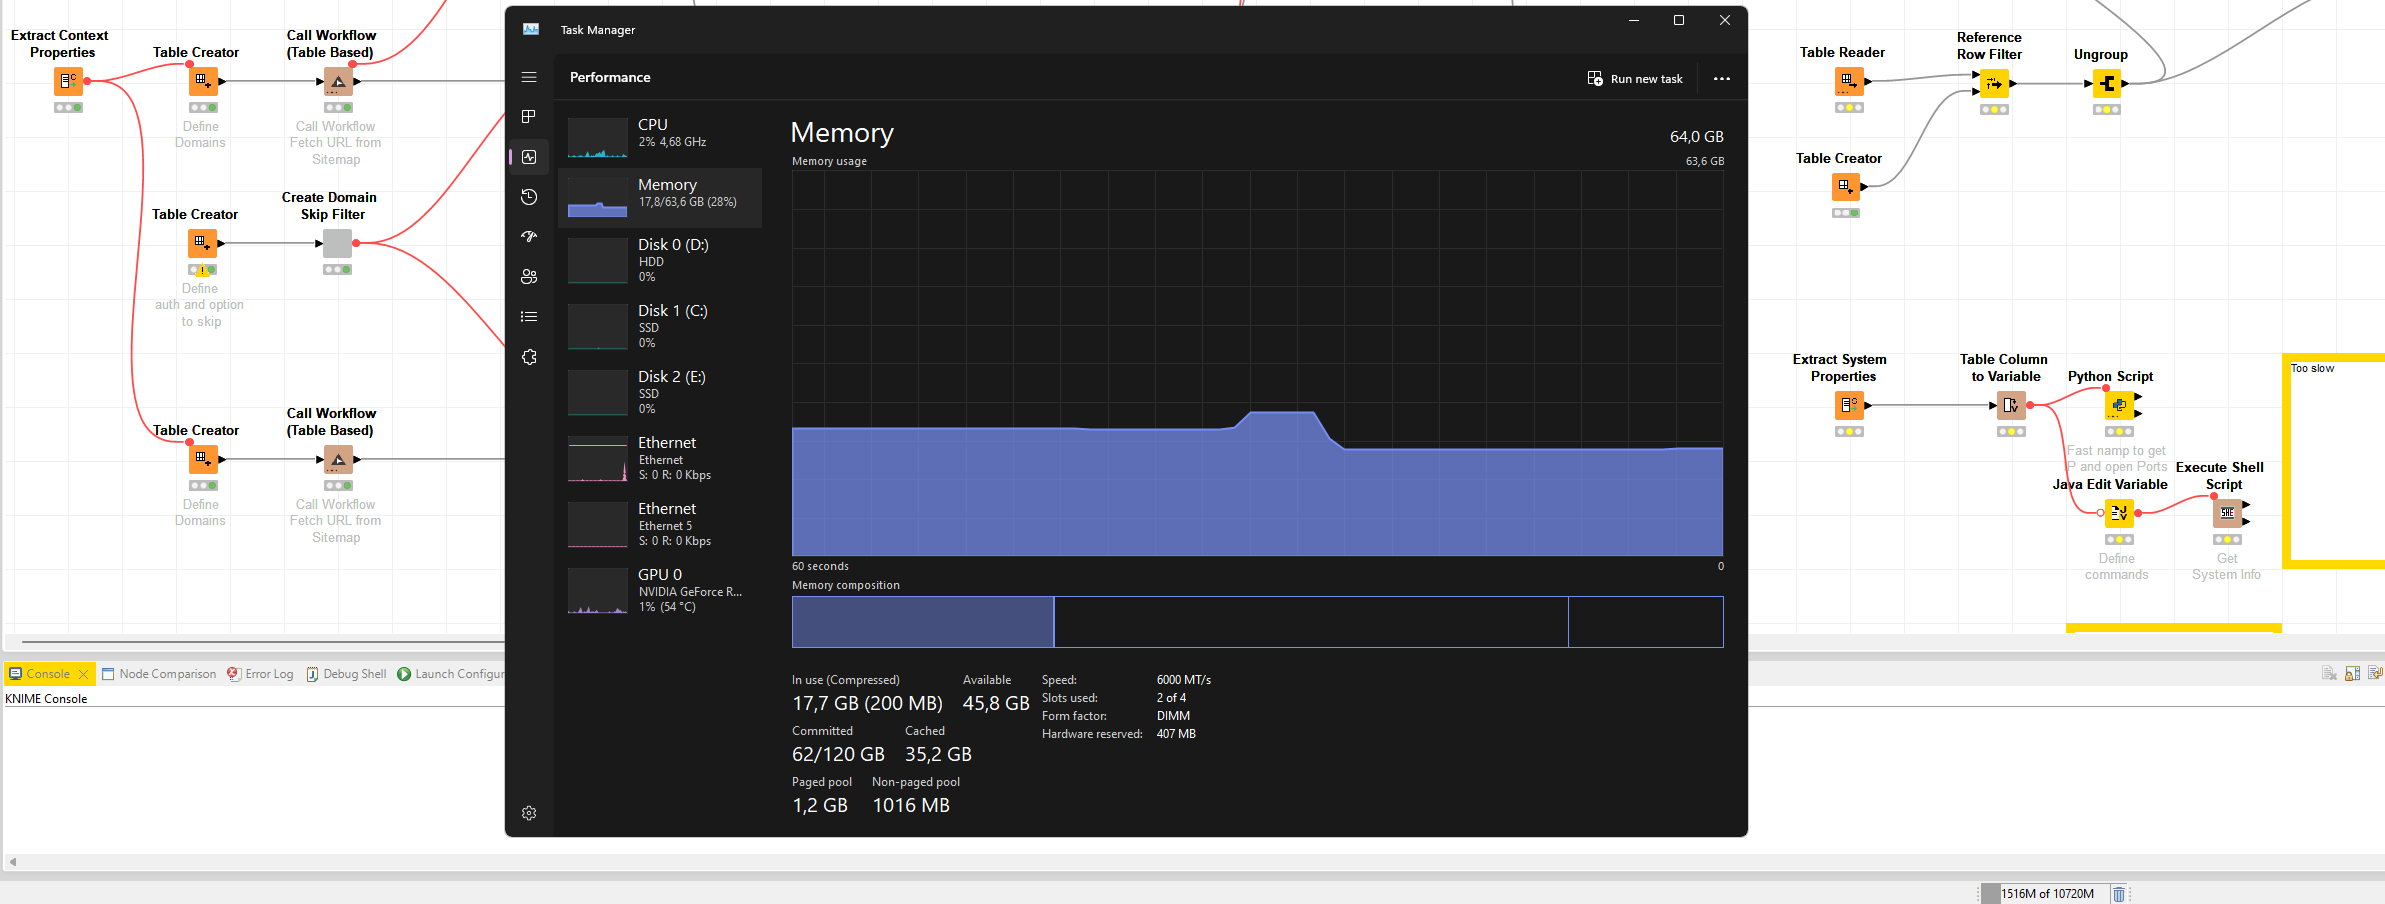
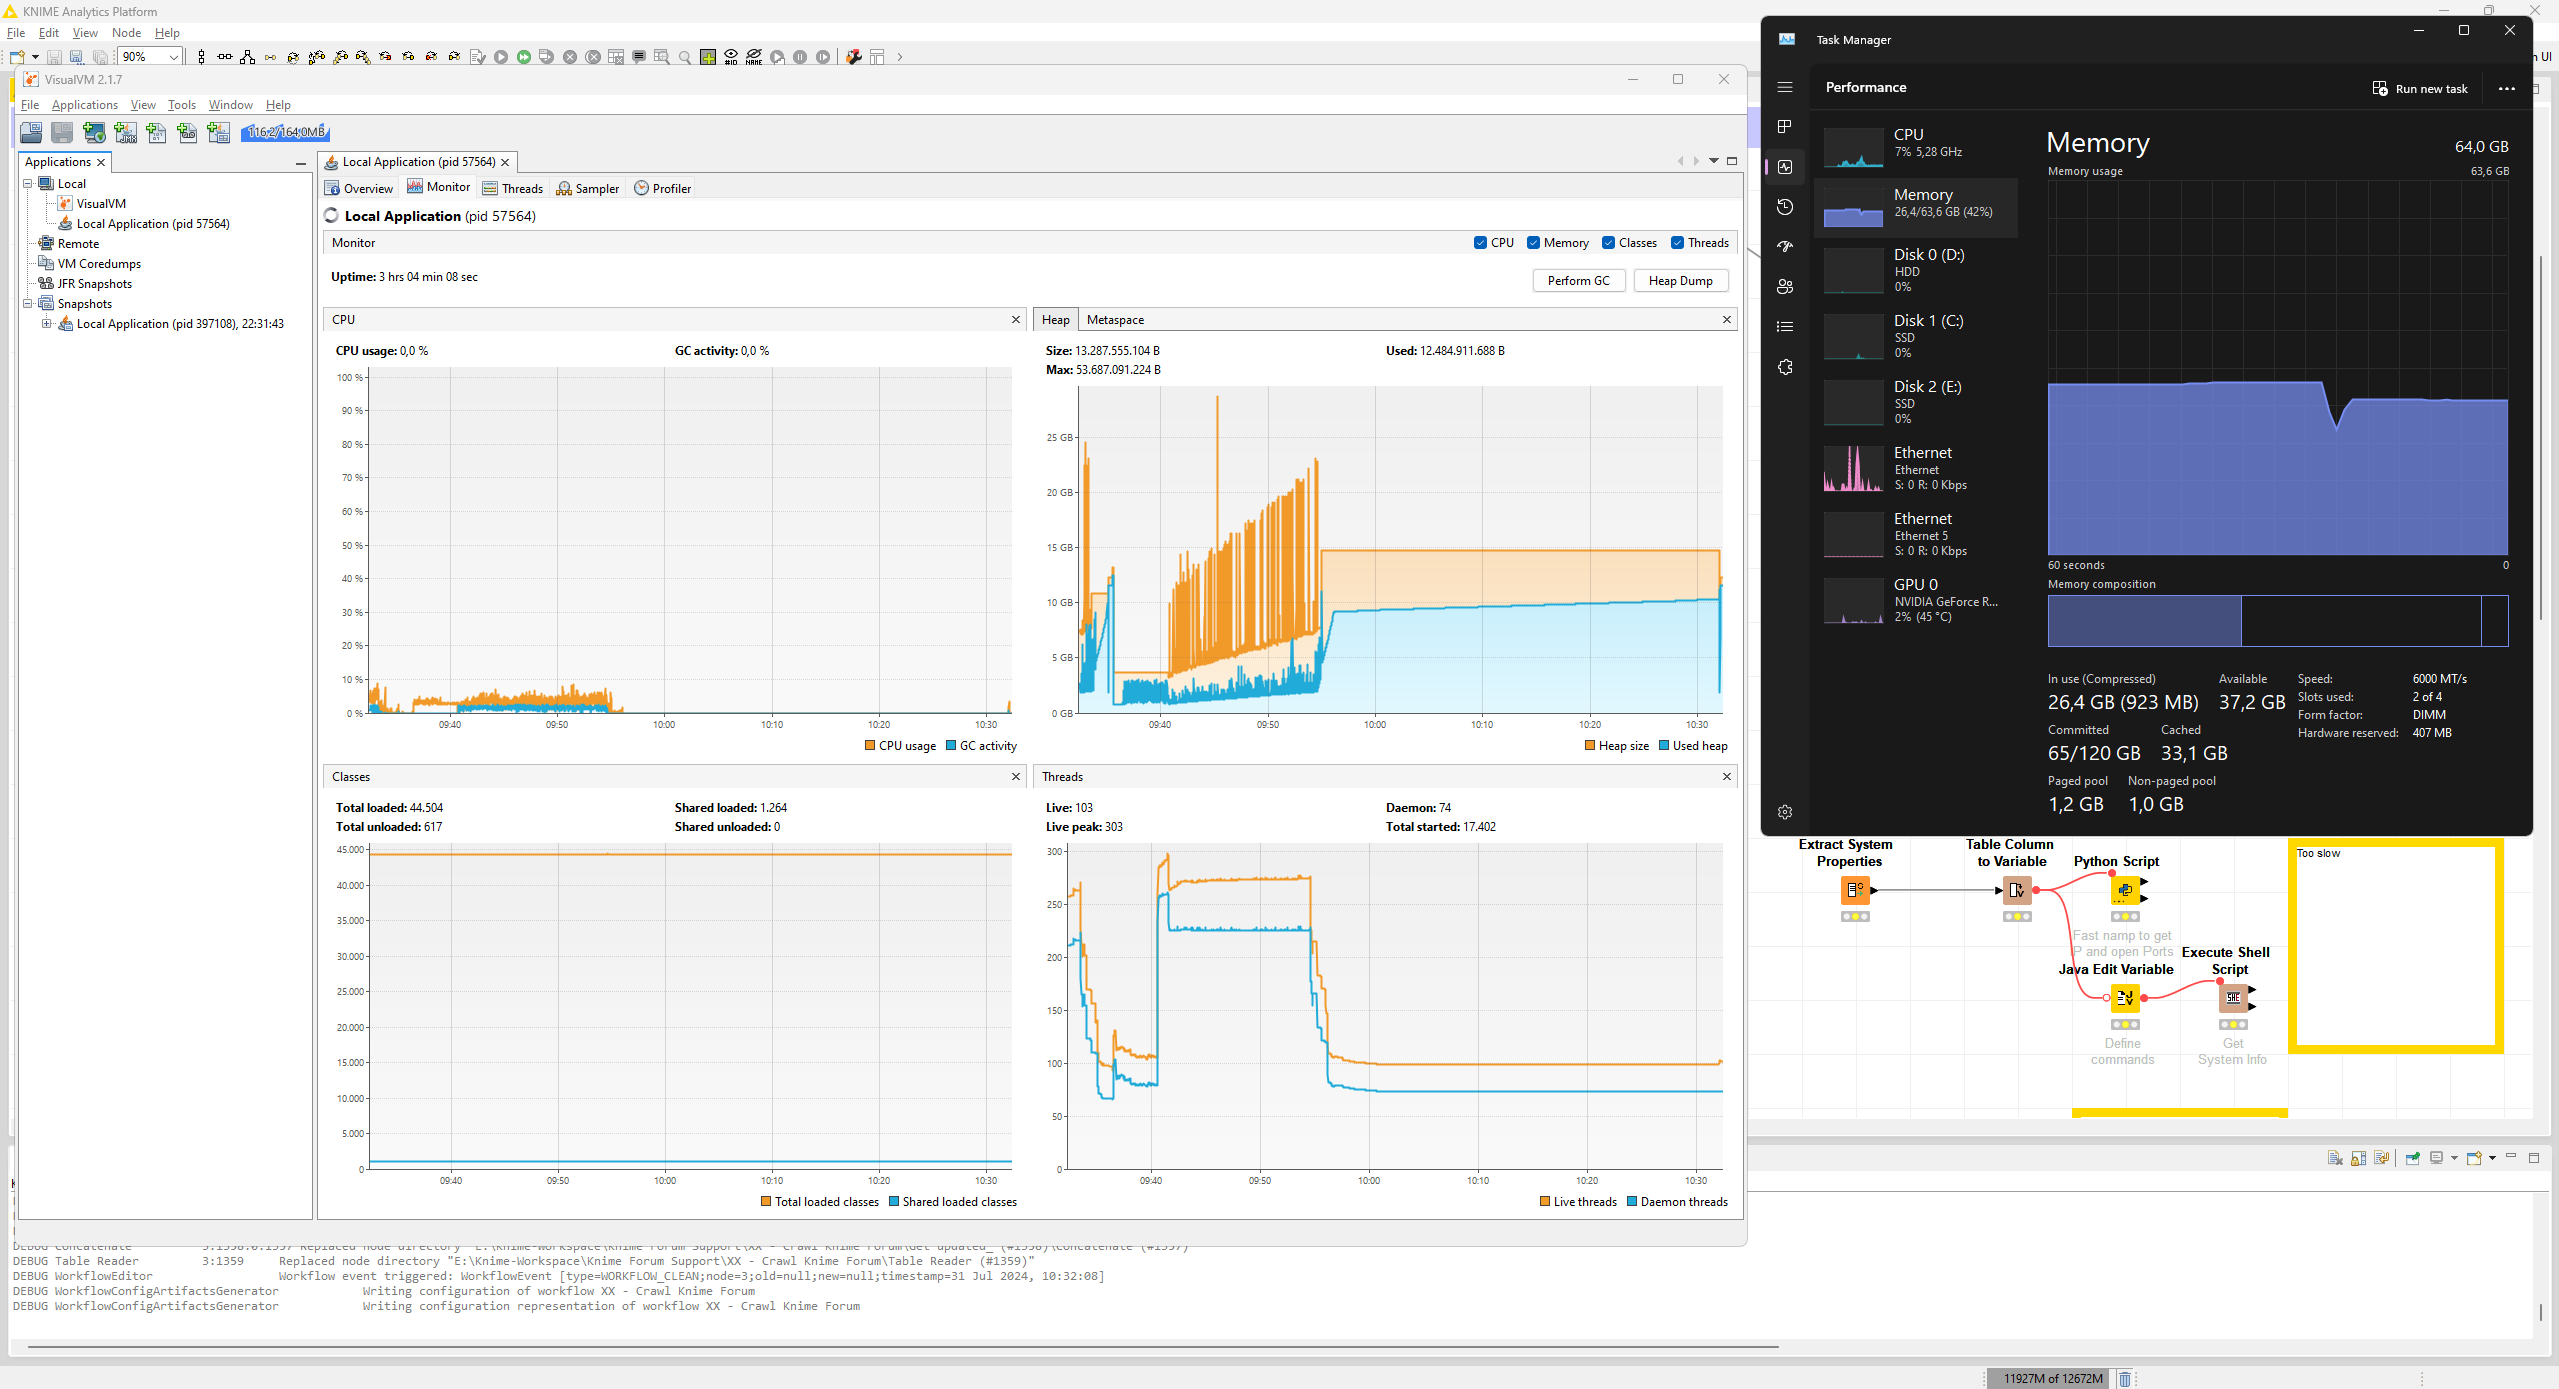
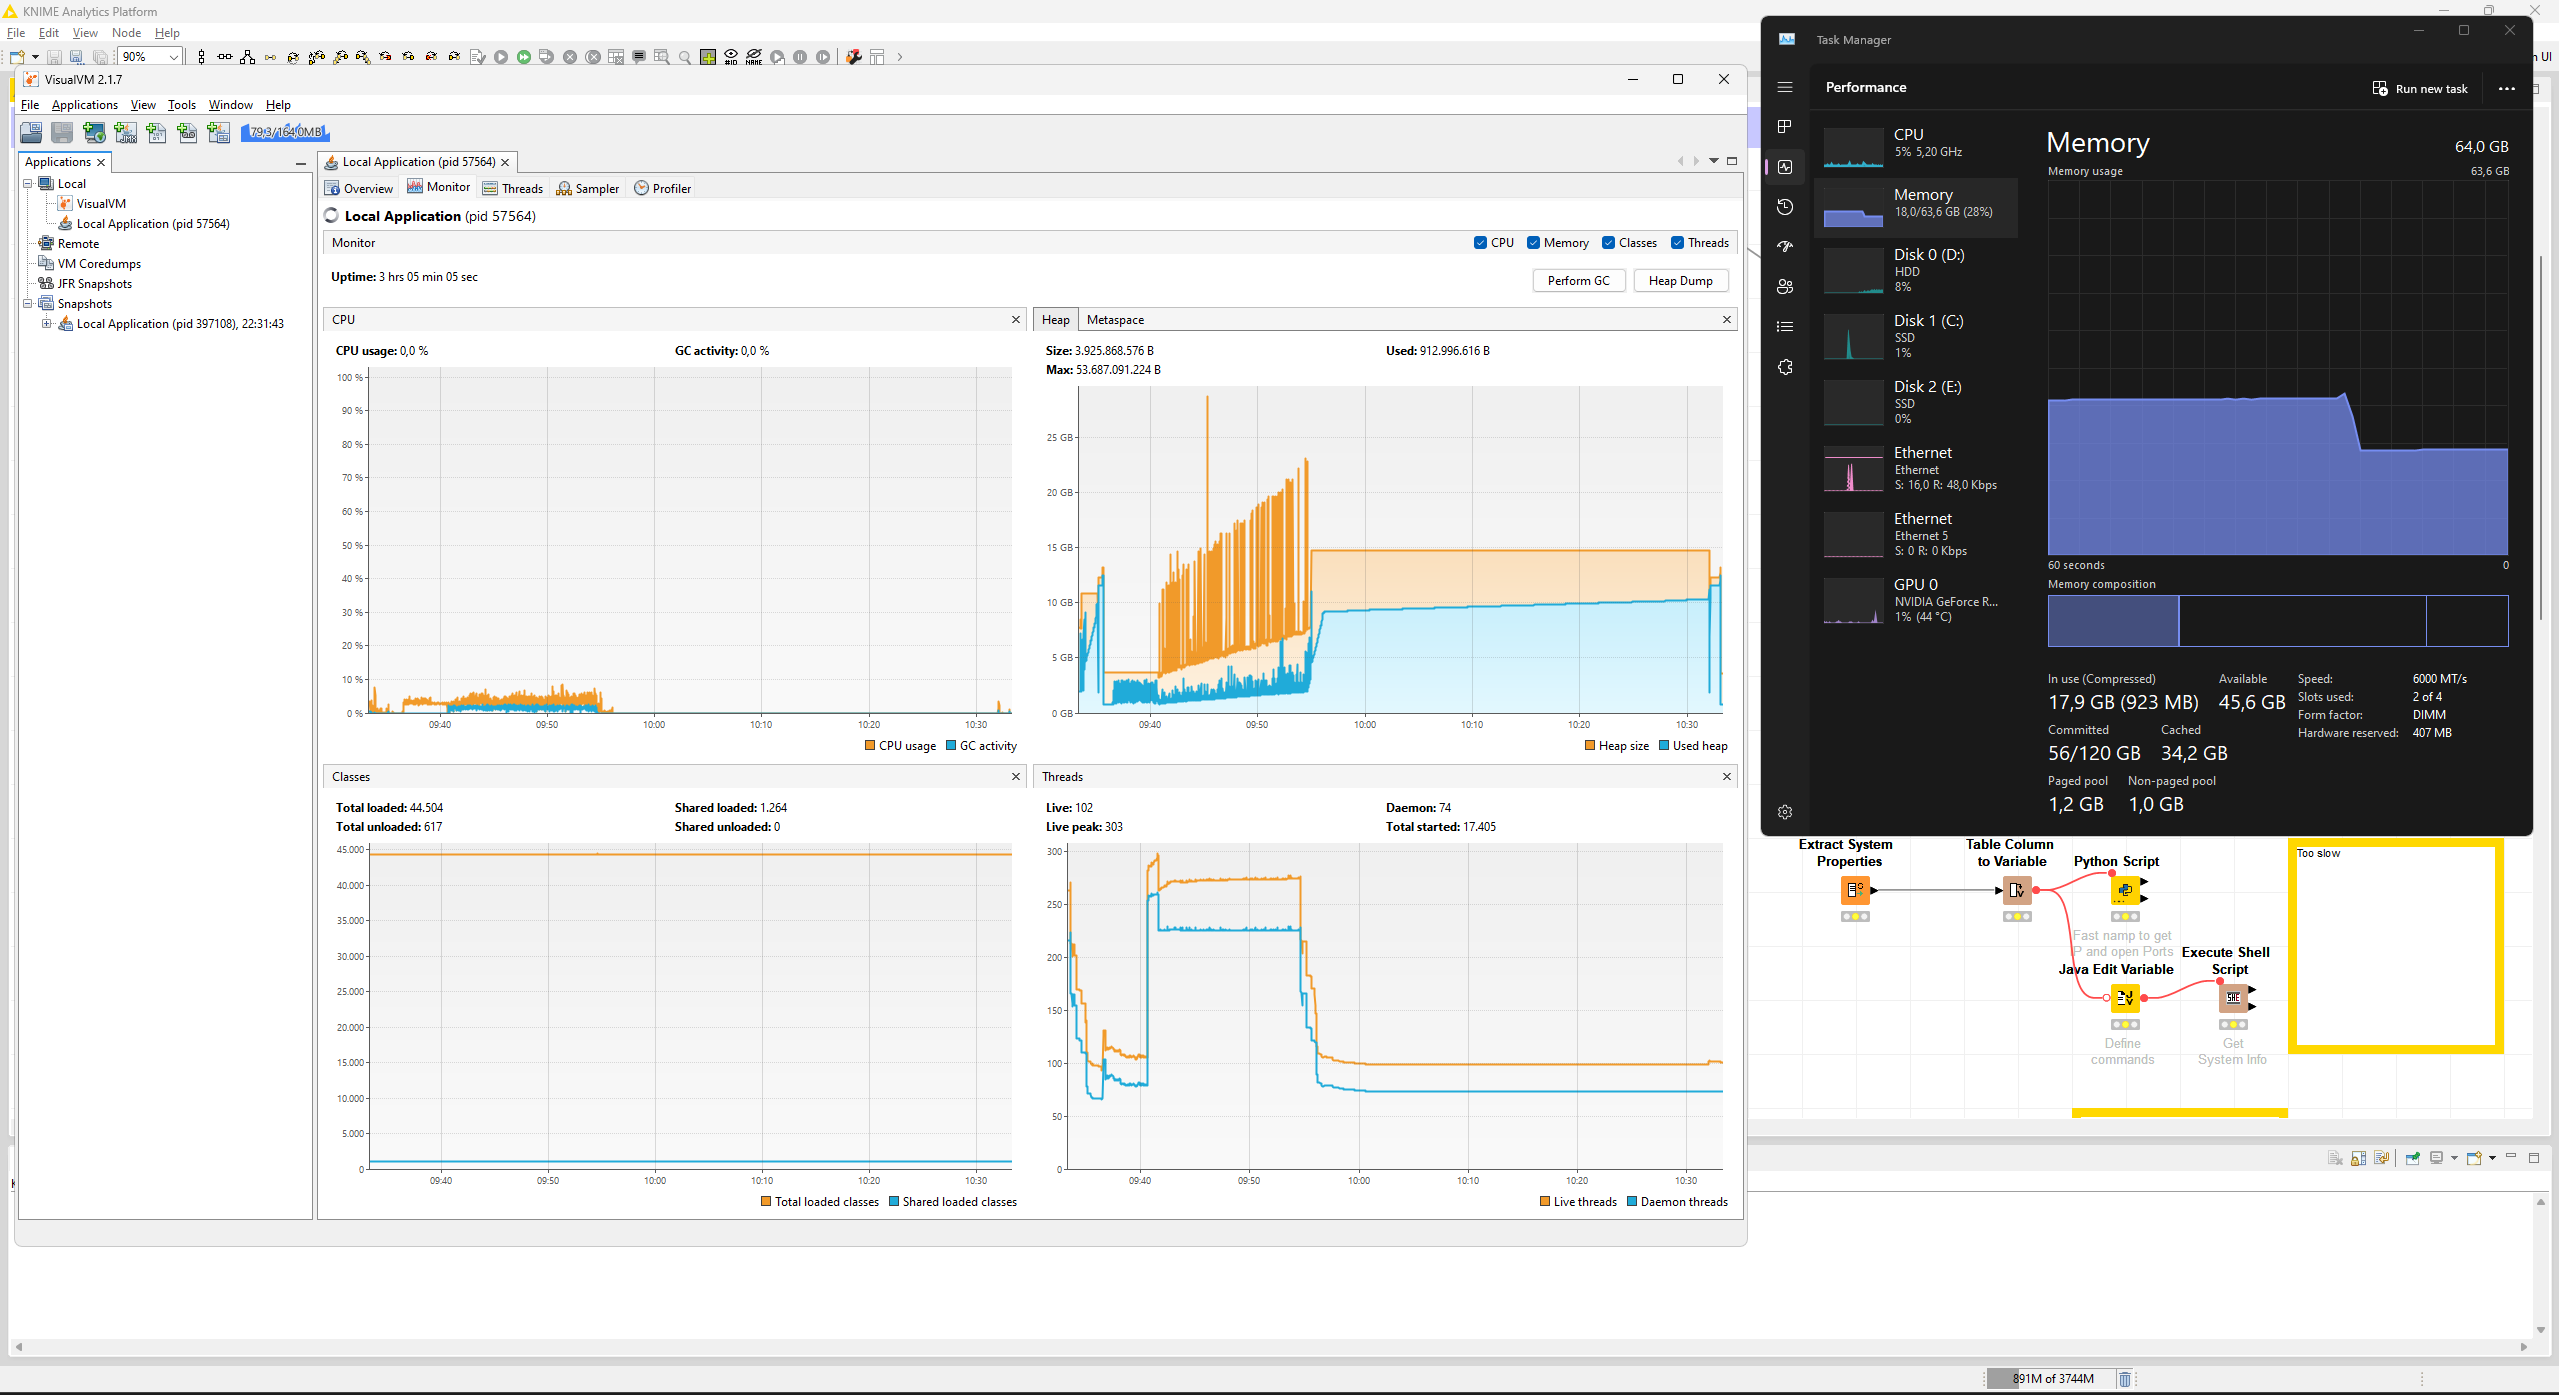
I ran a more extensive test doing three cycles of scraping 1k URLs each. Intriguingly, the memory allocation in Windows task manager never dropped but I digress about what Windows believes to report or not
I would trust the VisualVM memory report more than whatever Windows Task Manager reports. VisualVM knows about the JVM’s heap, Task Manager just sees some program wanted some large amount of RAM once – it might be that it is just not reclaimed by the OS yet even though the Heap already shrank after GC.
Could you send me the heap dump once more after
After clearing the console log and running another garbage collection
With the Memory Analyzer you can even extract that value to a file and it looks just like the Console log.
It does seem to be only the case on Windows, because I could not find such a field in the macOS implementation (Windows Accessible, macOS Accessible).
What is happening, is that clearing the log sends an accessibility event with the deleted and added content for the “text field” (so the Console), which is stored, so some Windows API can supposedly retrieve it later. The macOS implementation does not store the values. I am not sure how you could get this object to be garbage collected. Maybe by closing the Console view?
In any case, I opened a ticket (AP-23027). For the time being, you need to reduce the chattyness of the Console by not using the DEBUG level, unfortunately.