I am working on a project where I need to generate multiple scatter plots within a nested loop structure. Specifically, I want to:
Use the loop to vary some parameters (e.g., different ships).
I need to save each scatter plot as an image (PNG, JPG, etc.).
Once the loops are finished, I want to display or export all of the plots, either individually or in a compiled format (e.g., PDF).
I’ve tried using the Group Loop Start, Scatter Plot, and Image Writer nodes, but I’m running into issues saving and displaying the generated images after each iteration, and there is no output for the nodes generating my scatter plot.
In the Scatter Plot node I’ve selected Generate Image and still don’t see an output. I found it much easier to use the Generic Echarts View node instead of Scatter Plot.
I’m not entirely clear on what the intention is, but maybe this example will help. It shows how you can generate multiple scatterplots in a loop and store them in a table. And how you make them visible again. scatterplot_in_loop.knwf (374.3 KB)
Graph Creation:
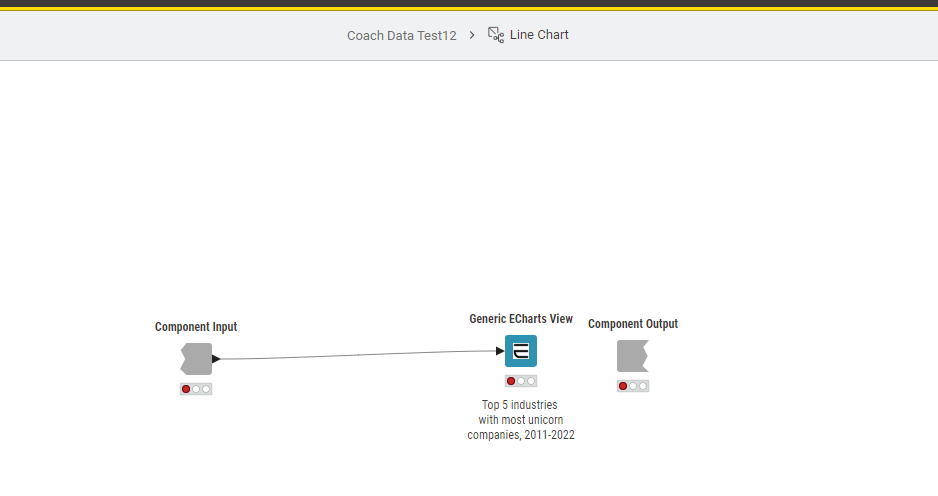
I want to create a graph with a line connecting the dots. The scatter plot node doesn’t support this. I’m using the Generic Echarts View node, but it only outputs data in a specific way, as shown in the second screenshot. This setup comes from a tutorial I found on the forums. The issue is that after I run a loop to generate multiple graphs, it stops after each iteration, and I have to manually press “execute” to continue.
Compiling Graphs:
I’m also trying to compile all my graphs into one document using the Report PDF Writer. However, the node only has options to either overwrite or fail, not to append. This means that each new graph replaces the previous one, which is not what I want. I need a way to add all the graphs to a single document without replacing them.