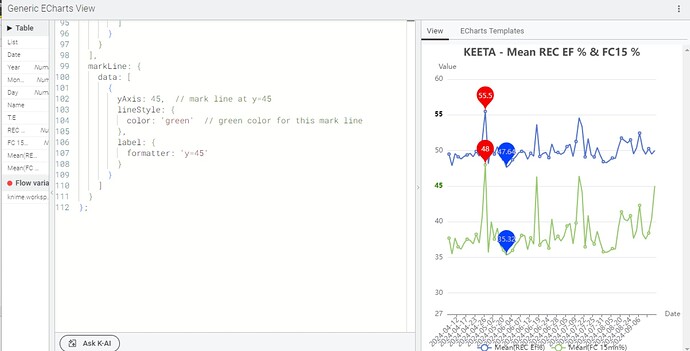
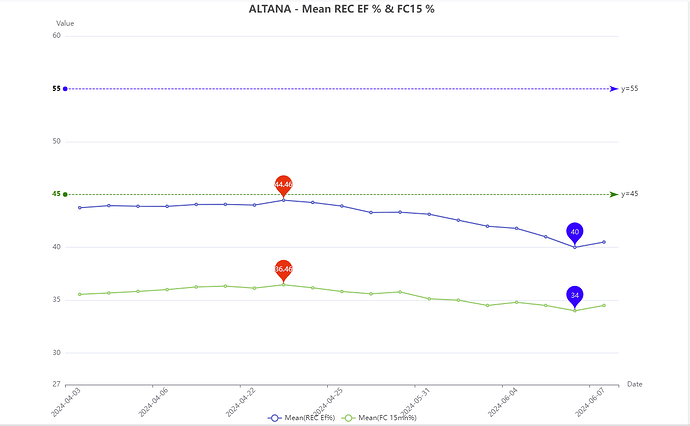
Was indeed in the wrong place. Here’s the code:
// Function to find the highest and lowest values and their indices
async function getExtremes(columnName) {
  const data = await inputTable.getColumn(columnName);
  const max = Math.max(...data);
  const min = Math.min(...data);
  const maxIndex = data.indexOf(max);
  const minIndex = data.indexOf(min);
  return { data, max, min, maxIndex, minIndex };
}

const meanRecEfExtremes = await getExtremes('Mean(REC Ef%)');
const meanFc15mnExtremes = await getExtremes('Mean(FC 15mn%)');

// Fetch the dates to have the most recent on the right
const dates = await inputTable.getColumn('Date');

// Fetch the company name
const companyName = (await inputTable.getColumn('Name'))[0]; // Assuming the company name is the same for all rows

// Sort the data by date to respect the chronology
const sortedData = dates.map((date, index) => ({
  date: date, // Keep the date in YYYY-MM-DD format
  meanRecEf: meanRecEfExtremes.data[index].toFixed(2), // Format to 2 decimal places
  meanFc15mn: meanFc15mnExtremes.data[index].toFixed(2)  // Format to 2 decimal places
})).sort((a, b) => new Date(a.date) - new Date(b.date));

option = {
  title: {
    text: `${companyName} - Mean REC EF % & FC15 %`, // Updated title to include company name
    left: 'center'
  },
  tooltip: {
    trigger: 'axis'
  },
  legend: {
    data: ['Mean(REC Ef%)', 'Mean(FC 15mn%)'],
    top: 'bottom'
  },
  xAxis: {
    type: 'category',
    name: 'Date',
    data: sortedData.map(item => item.date), // Use all dates
    axisLabel: {
      interval: 2, // Show one date every three dates
      rotate: 45  // Rotate labels for better readability
    }
  },
  yAxis: {
    type: 'value',
    name: 'Value',
    min: 27, // Set the minimum value of the y-axis to 27
    max: 60,  // Set the maximum value of the y-axis to 60
    axisLabel: {
      formatter: function (value) {
        if (value === 45) {
          return '{value|45}';
        }
        if (value === 55) {
          return '{bold|55}';
        }
        return value;
      },
      rich: {
        value: {
          fontWeight: 'bold',
          color: 'green'
        },
        bold: {
          fontWeight: 'bold',
          color: 'black'
        }
      }
    }
  },
  series: [
    {
      name: 'Mean(REC Ef%)',
      type: 'line',
      data: sortedData.map(item => item.meanRecEf), // Use all data points
      markPoint: {
        data: [
          { type: 'max', name: 'Max', itemStyle: { color: 'red' } }, // Highest value in red
          { type: 'min', name: 'Min', itemStyle: { color: 'blue' } } // Lowest value in blue
        ]
      },
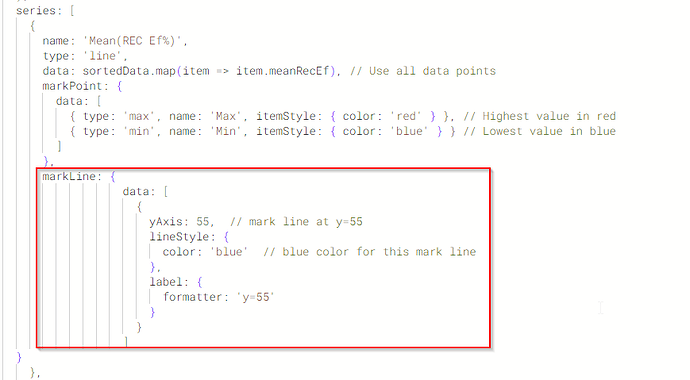
      markLine: {
                  data: [
                    {
                      yAxis: 55,  // mark line at y=55
                      lineStyle: {
                        color: 'blue'  // blue color for this mark line
                      },
                      label: {
                        formatter: 'y=55'
                      }
                    }
                  ]
  }
    },
    {
      name: 'Mean(FC 15mn%)',
      type: 'line',
      data: sortedData.map(item => item.meanFc15mn), // Use all data points
      markPoint: {
        data: [
          { type: 'max', name: 'Max', itemStyle: { color: 'red' } }, // Highest value in red
          { type: 'min', name: 'Min', itemStyle: { color: 'blue' } } // Lowest value in blue
        ]
      },
      markLine: {
                  data: [
                    {
                      yAxis: 45,  // mark line at y=45
                      lineStyle: {
                        color: 'green'  // green color for this mark line
                      },
                      label: {
                        formatter: 'y=45'
                      }
                    }
                  ]
  }
    }
  ],

};
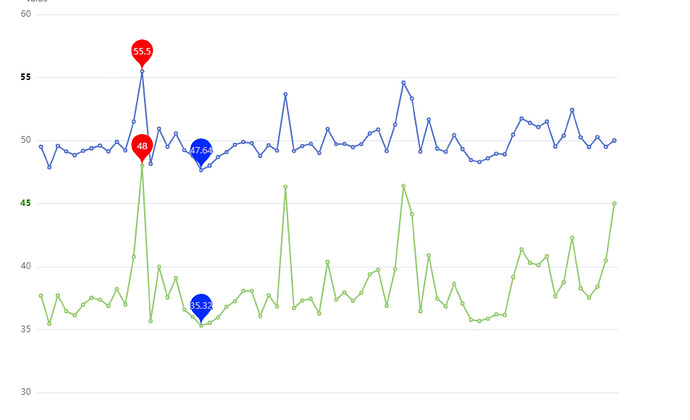
Here’s the outcome:
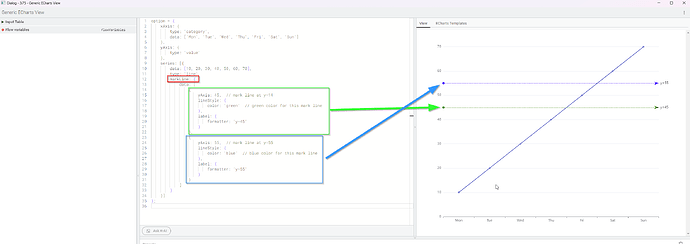
the markLines need to go into the objects that are inside your series array - e.g. for the first one:
