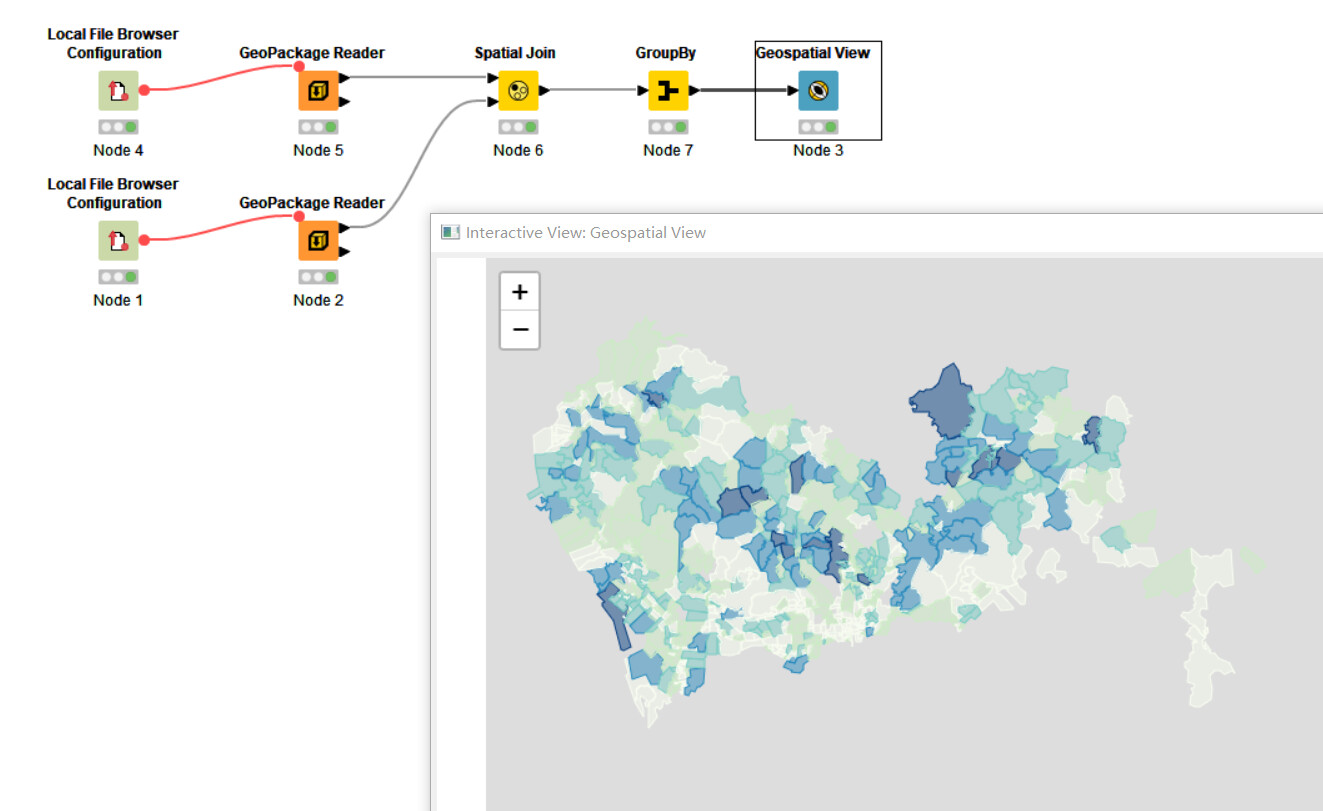
What we are sharing today is a very simple case study: counting the number of kindergartens in Shenzhen communities based on the future of Shenzhen, China.
With the help of the geospatial analytics node library, the number of kindergartens in each community is calculated using Shenzhen community elements as the object. And visualize it.
This case is very simple, using ideas such as data reading, layer filtering, spatial connectivity, aggregation attributes, and visualization.
This is my first geospatial analytics case. I hope to promote the geographical Spatial analysis function of the KNIME software, especially in the application of re geography, urban planning, health and health safety, spatial economics, etc. I will continue to share more cases with you later. Welcome to leave a message for communication.
Thank you for your reply. In fact, I have been constantly learning and using, even though my KNIME level is not high enough.
Next, I will continue to explore the application of KNIME software in geographical Spatial analysis, and share some of my own workflows as much as possible to promote more exchanges in this regard.
Of course, the most important thing is to ask for more guidance from you.
Hi @GISer_last thank you very much for sharing your progress with the Geospatial Analytics extension.
If you’d like to share your work in the form of a data story (blog post), consider submitting it to “Low Code for Data Science”, KNIME community publication on Medium.
You can find out how to contribute and other resources in the “Contribute – Low Code for Data Science” section. For the key info, here is a short summary: