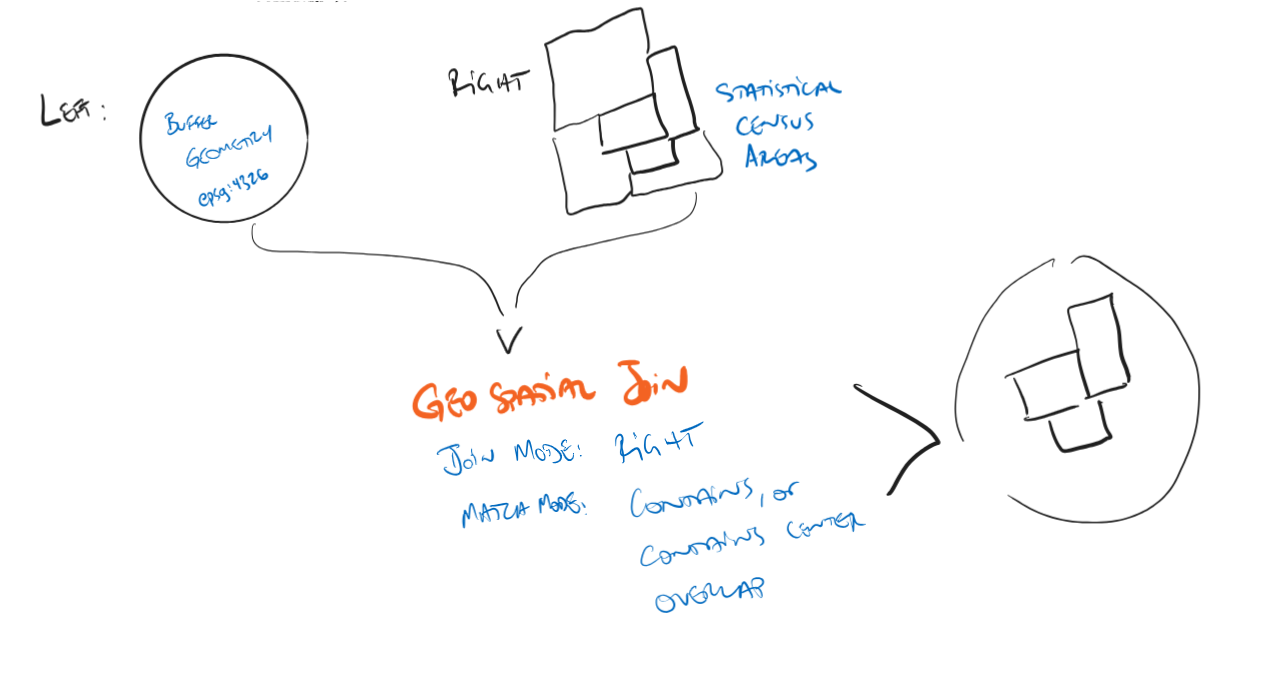
On the left, I have a simple circular buffer geometry (~1.5km).
On the right, I have a list of neighbourhood statistical census areas (and their geometries).
My join objective is simple: see which of these areas (“Dissemination Area”, or “DA”) can be contained, fit, or mostly fit inside the buffer on the left:
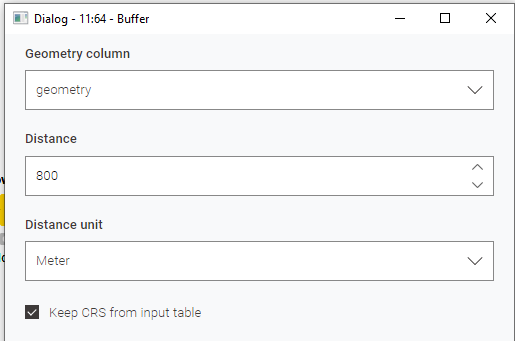
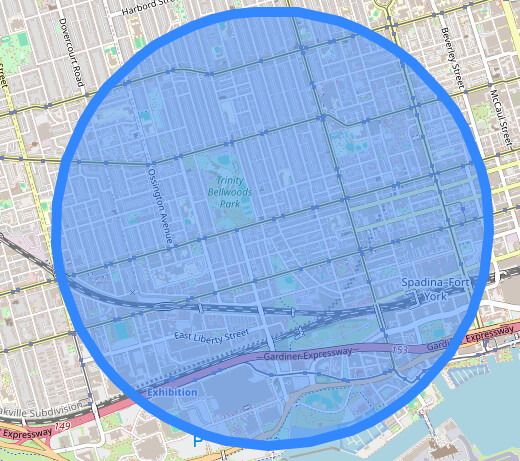
On the left side, the buffer zone looks correct when spatially viewed:
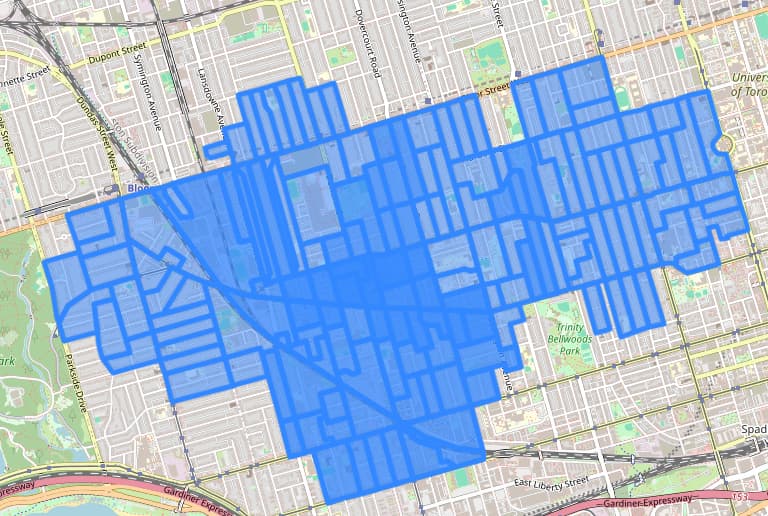
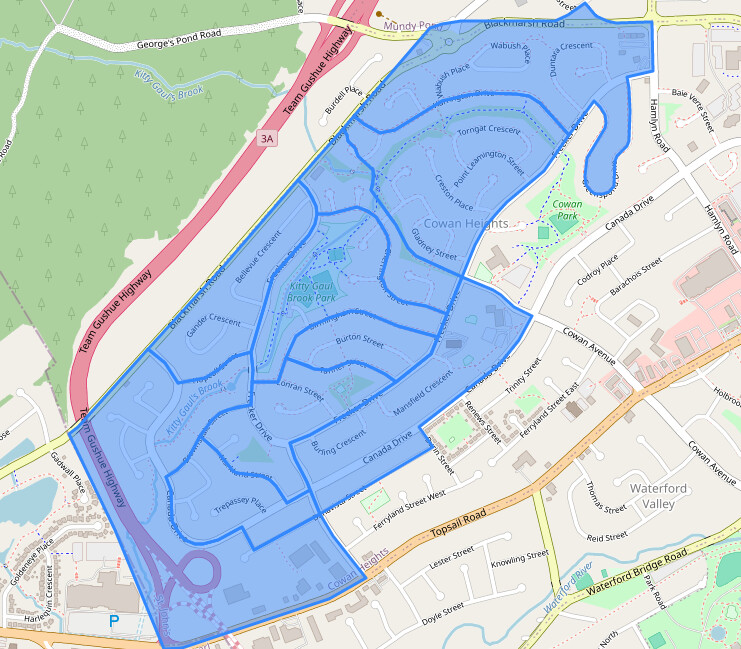
Similarly on the right side, DA geometries look correct:
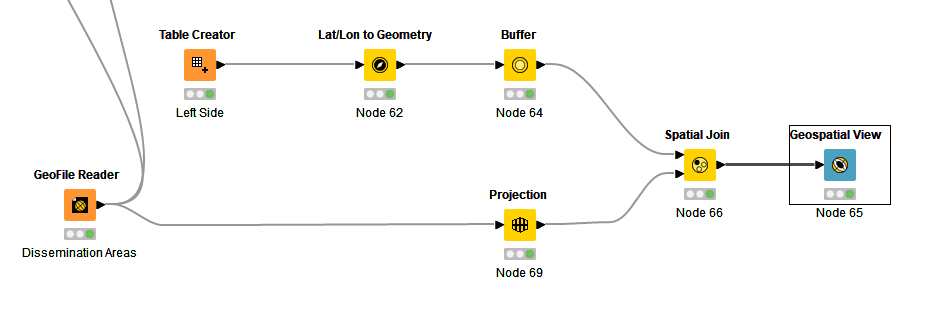
My join settings:
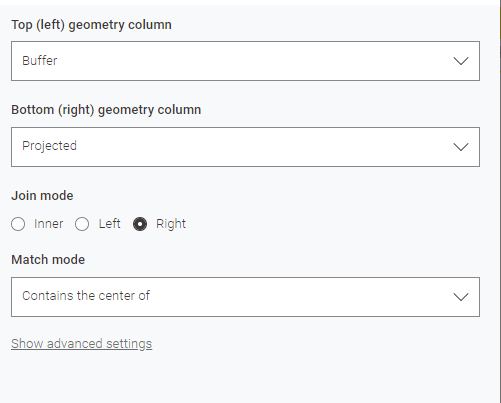
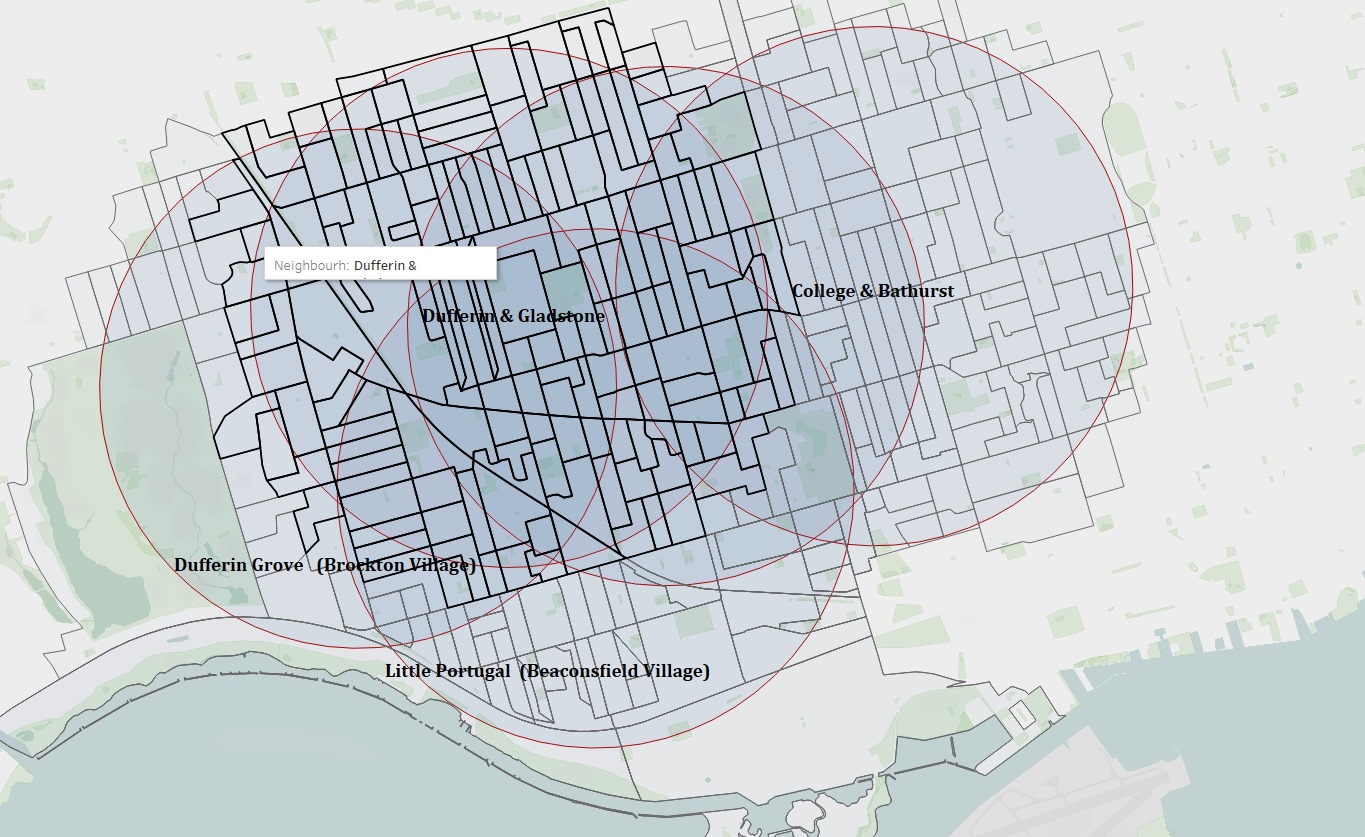
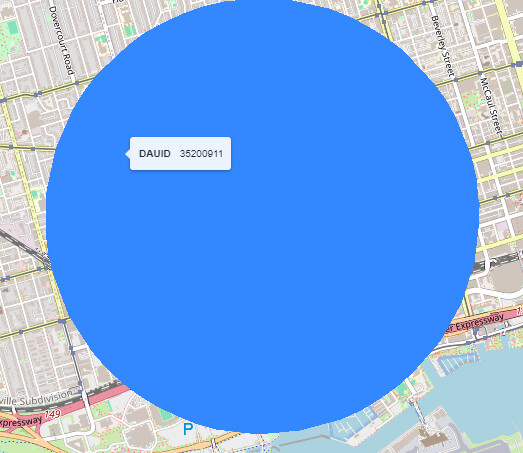
My output always ends up being a solid circle, with a single DA label on it:
Appreciate any tips.