When using the -Generic JavaScript View- node, is it possible to click on a point on the plot and get the coordinates stored as either a variable or two variables, so that I can use them later in my workflow?
Hi,
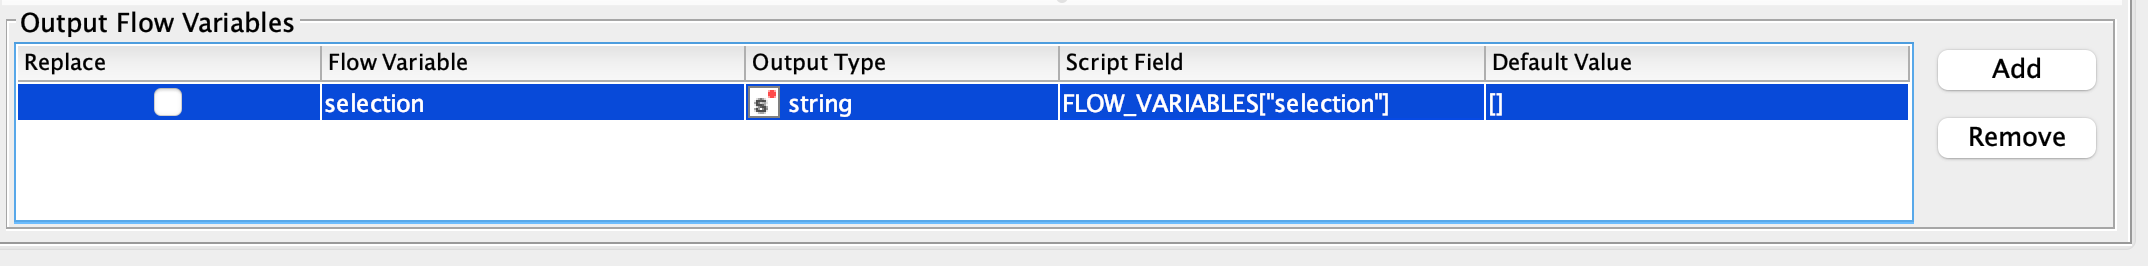
You need to add an output flow variable at the bottom of the Generic JavaScript View’s configuration dialog, then you can use the following code at the end of your plotly_selected event handler:
Now the selection will be available as flow variable named “selection”. I encoded it as JSON, so to process it further, you’d need to turn the variable into a table row and then use a JSON Path to get the individual RowIDs.
Please find the modified workflow attached.
Kind regards,
Alexander
Is it possible to make one of the selection options on the view (box/lasso) the default rather than the zoom before opening the interactive view so that it doesn’t need to be selected by hand?
I can see that it works using the Box and Lasso. However, if we want the coordinates of just one point, is it possible to get the coordinates just by clicking on the point?
In all cases, once the selection is done, we would like the node to be executed and the variables to be passed to the next node for execution without needing to click on apply. Is it possible to implement/force this programmatically in the JavaScript code?
I could not find a way to do that in Plotly. There is a similar question here, but it is unanswered.
You could do that in KNIME Server or KNIME Business Hub by writing some JavaScript code that “virtually” clicks the “Next” button in the browser. But this would be a rather hacky solution, as the website layout may change, breaking the behaviour. In KNIME AP, this is not possible at all because for security reasons JavaScript cannot influence anything outside of the browser window.
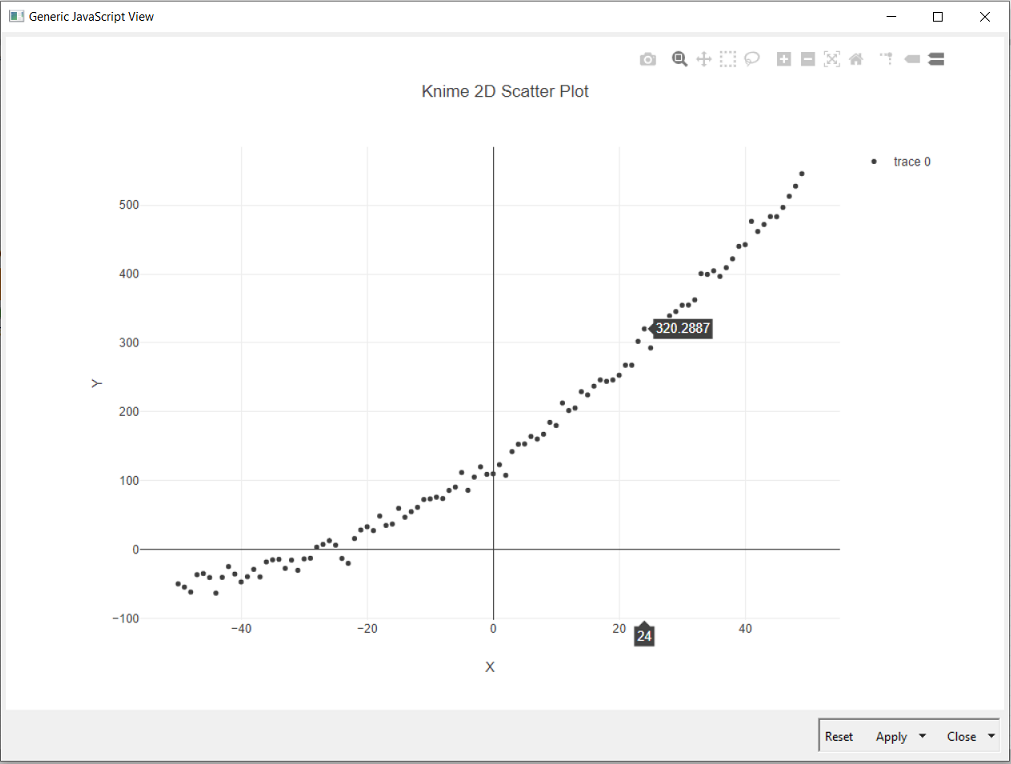
We just found out how to get the data point coordinates based on a click rather than using the selection options.
The original/template JavaScript uses ‘plotly_selected’:
//Knime selection event publishing; selection events
document.getElementById('knime-scatter').on('plotly_selected', function (eventData) {
    if (!eventData) {
        return;
    }

    var selection = [];

    eventData.points.forEach(function (pt) {
        selection.push(pt.data.id[pt.pointIndex]);
    });

    knimeService.setSelectedRows(knimeDataTable.getTableId(), selection);
    FLOW_VARIABLES["selection"] = JSON.stringify(selection);
});
This can be changed to ‘plotly_click’:
//Knime selection event publishing; selection events
document.getElementById('knime-scatter').on('plotly_click', function (eventData) {
    if (!eventData) {
        return;
    }

    var selection = [];

    eventData.points.forEach(function (pt) {
        selection.push(pt.data.id[pt.pointIndex]);
    });

    knimeService.setSelectedRows(knimeDataTable.getTableId(), selection);
    FLOW_VARIABLES["selection"] = JSON.stringify(selection);
});
Therefore allowing you to get the coordinates of one data point with just a click!
Just wanted to share this in case its useful for anyone
Additionally, do you know if this same level of interactivity is available using the Python View node? If so, would you be able to share an example of it in the workflow please?
I think the same level of interactivity is not possible with the Python View node, but if you use Plotly in Python you can export the plot as JSON, pass that via flow variable to the Generic JavaScript View, and then use the plotly.js library there to render it. That’s also a bit tedious, though.
Kind regards,
Alexander