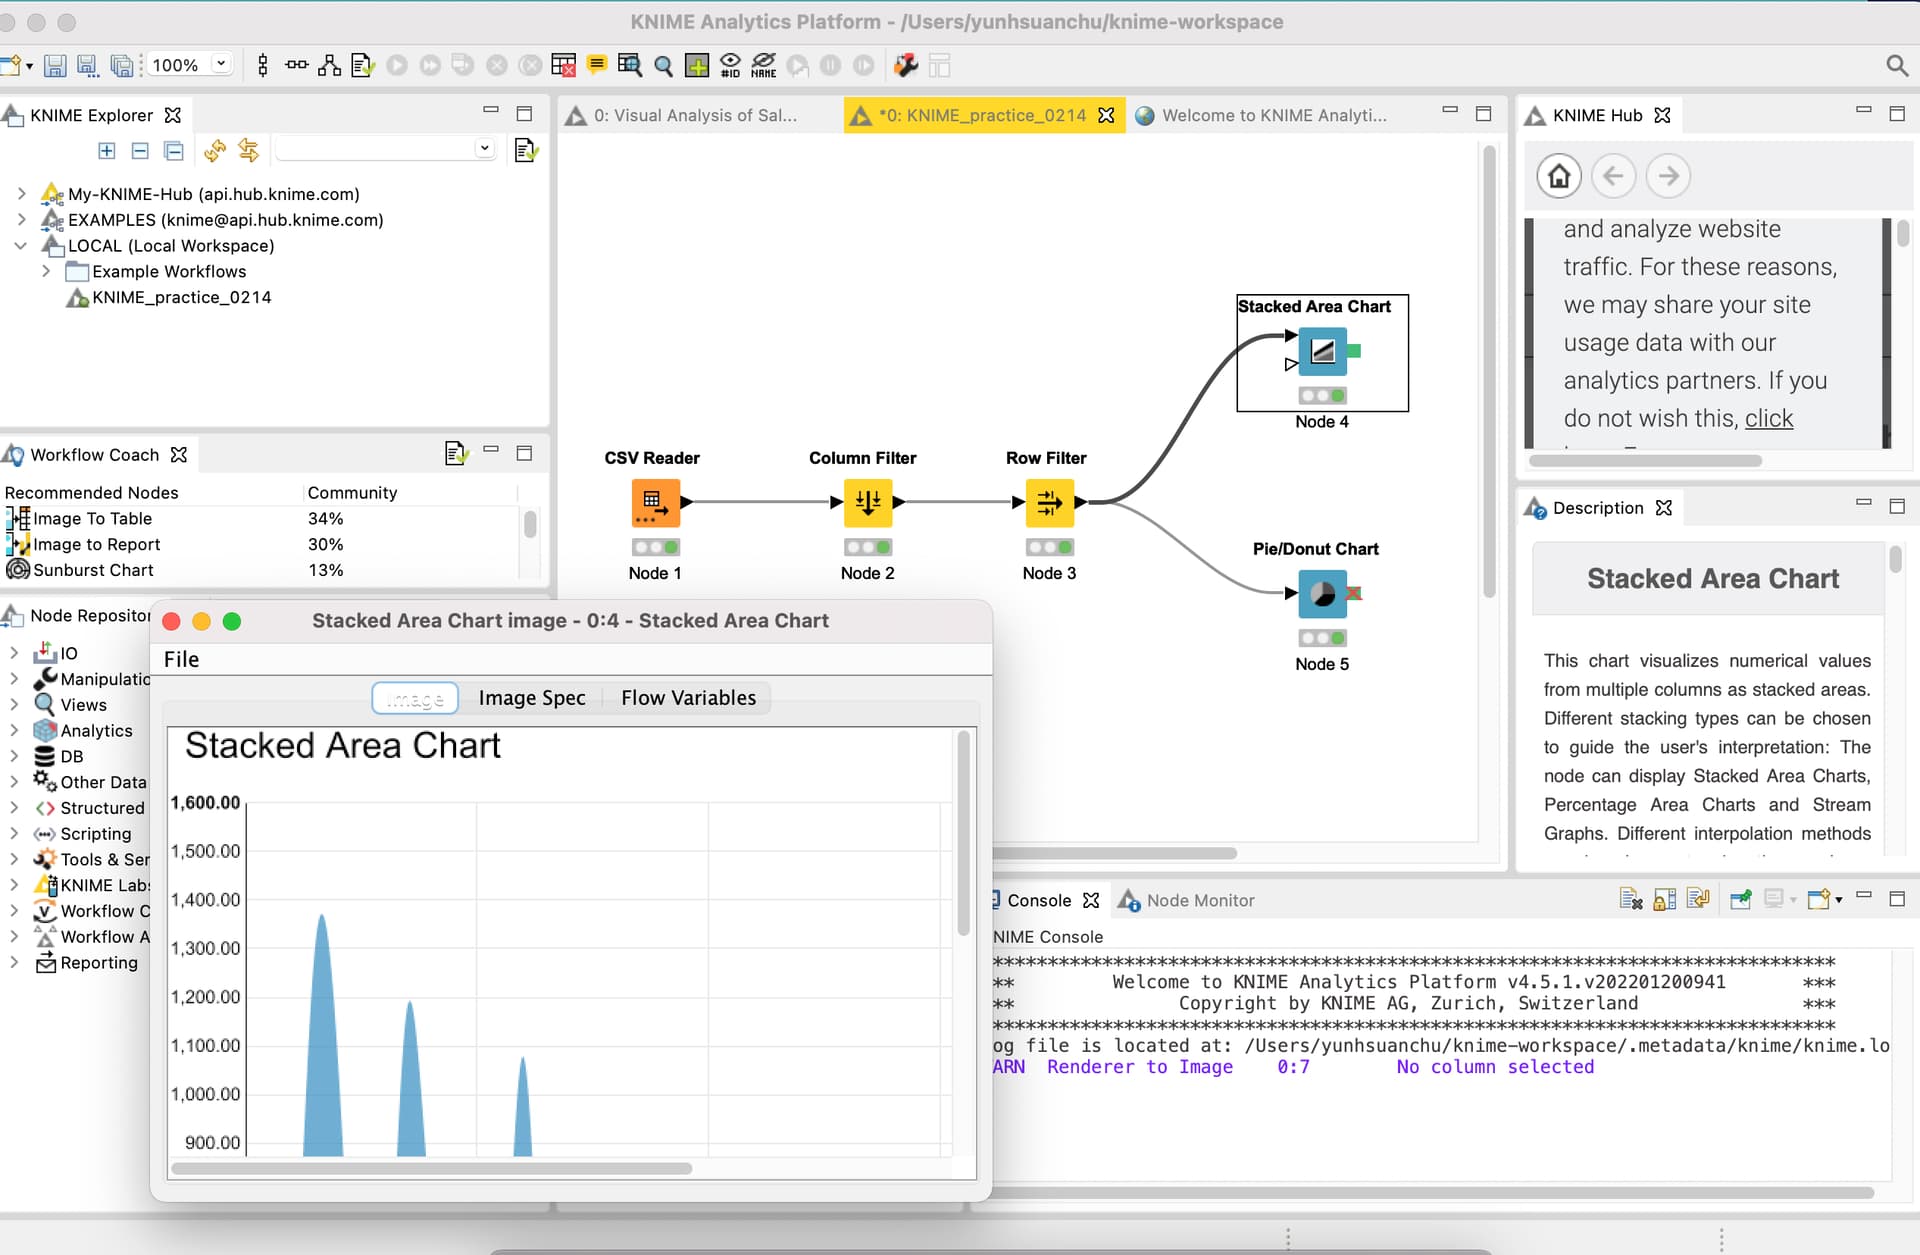
- Name of the workflow: read, transform and visualize sales data
- URL reference: KNIME Getting Started Guide | KNIME
- Why I chose this reference: step by step to build my first workflow
- What I learned: read, filter, and visualize data
- challenges or questions: for the Stacked Area Chart and Pie/Donut Charts, it only allowed me to “Execute and Open Views” once, is this normal? (once I closed the window of visualization, I couldn’t generate it again)
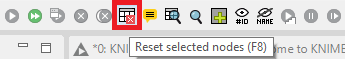
If a node is executed (as signaled by the green traffic light), it can’t be executed it again unless it’s reset first.
So, if you want to re-execute the node, you need to first reset it. This can be done by right clicking on the node and selecting Reset, or pressing F8, or clicking on the appropriate button in the toolbar:
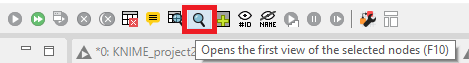
However, if you only want to see the visualization output, then right click on the node and select Interactive View, or select the node and press F10, or select the node and click the appropriate toolbar icon:
This topic was automatically closed 90 days after the last reply. New replies are no longer allowed.