Hi All
So after much trial and error and having some good fun with Knime, i’m pleased to announce i have released to hub a component that resolves 3 key pain points of the Google Analytics Query node.
Presenting the Google Analytics Query - 120Feet Edition together with a couple of helper tools
The Google Analytics Metadata - required for the interface to work
The data selector - A calendar interface to feed multiple instances of the component for those multi-query jobs.
If you have been using the Google Analytics Query node and have a good browse through the forum there are 3 pain points which emerge regularly.
- Re-try on fail. The node randomly fails with a read timeout error. This apart there could also be a bunch of other reasons the node fails.
- Pagination. What happens when the query generates more rows than the max set? How do you call the next page/s.
- Accuracy. The GA Reporting API will use Sampling when the request uses lots of data for the requested metrics (normally occurs for any request for data over more than one day if the website is busy.) This leads to data not correlating with the GA UI and in essence inaccurate metrics (I’ve seen cases where the metrics returned are way off trend…)
The Google Analytics Query - 120Feet Edition resolves all of the above. Here’s what i did;
Nested Loops for the win
Re-Try on Fail
There a number of way that this could be done, ultimately i landed on wrapping the node in a try-catch recursive loop. This is the innermost loop.
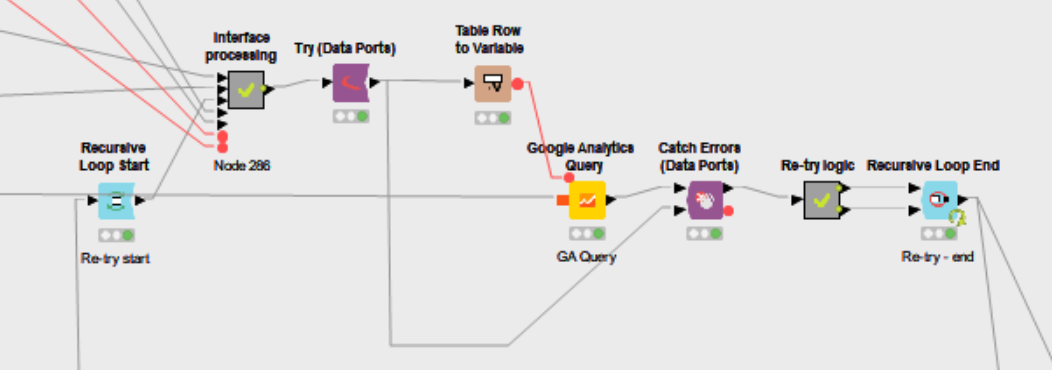
As i’m feeding the original stream into the 2nd input of the catch, the re-try logic looks checks if the column containing one of the query parameters is populated. If not it means the query succeed and feeds to the recursive loop top input. If it failed, it will come out of the bottom and feedback into the loop. Thereby re-trying that query again.

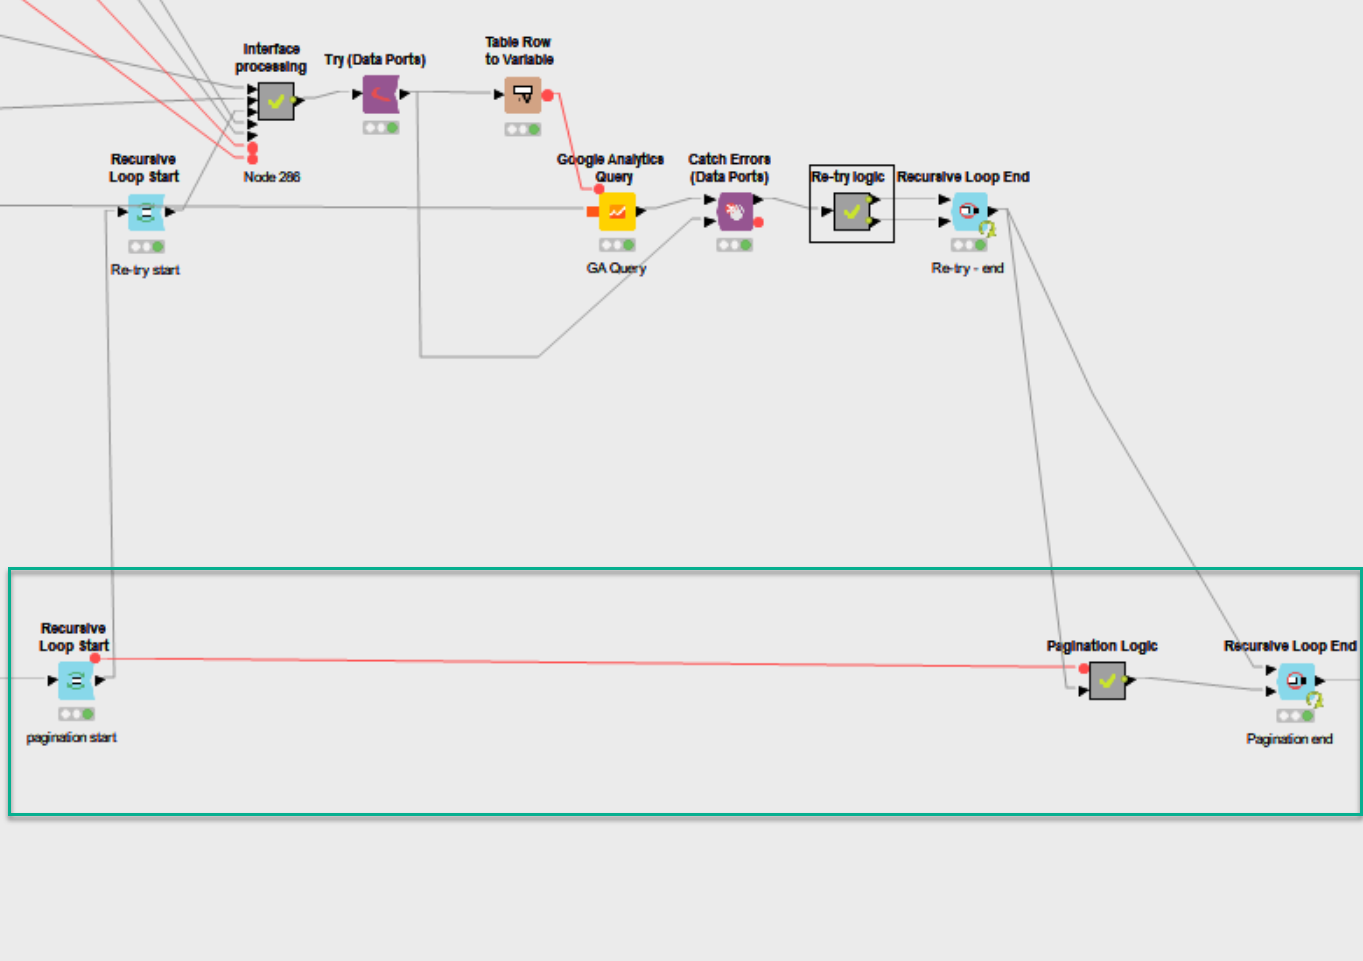
Pagination
Resolving pagination utilised another recursive loop wrapping the re-try section.
The GA Query node max records was set to 10,000. (there is no real reason in this instance that it needs to be set to anything other. )
The pagination logic

The idea here was to use the iteration number of the loop to figure out the starting index.
The data input takes its feed from the query node returned data. We do a row count and check if the number of rows is equal to 10K. This is fed to an ‘If’ node. If it is = 10K then the iteration number is fed to a math formula node that calculates the next start index. Else the bottom path is used which generates no rows. The output of the logic metanode is fed into the recursive input. So if there are no rows fed then there are no more pages to fetch.
If a row is fed, it re-runs the query with the new start index.
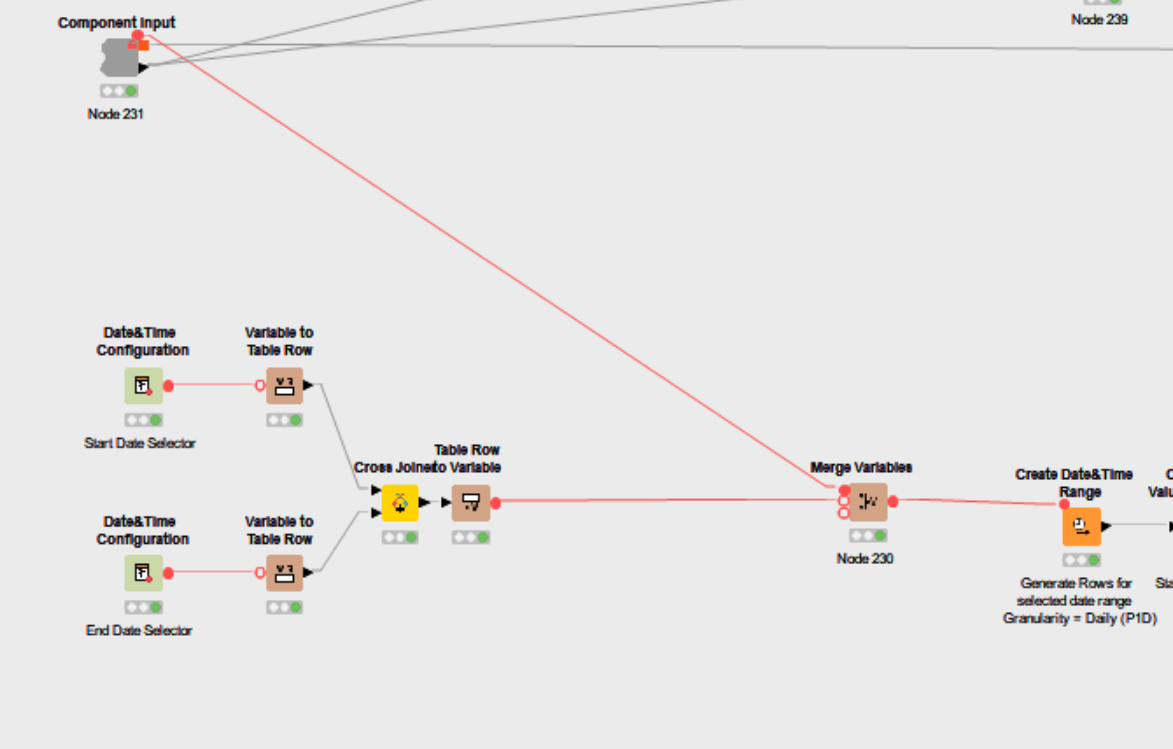
Accuracy
This is the outermost loop and is a simple table row to variable loop.
We take a start date and end date either from the component interface or from a flow variable into the component and feed this to a Create Date&time Range node with a 1 day setting. This generates a row per day with a date for each day. We then append this column to the other interface columns and feed them as flow variables to the Google Analytics Query node.
The end result is a repeated query for each day in the selected range, that avoids GA reporting using sampling.
The Interface Build
The final bit was making the interface available to the component config to allow users to generate their query.
The hard bit was the dimension and metric selection, mostly because i was barking up the wrong tree with the metadata api having missed the GET request format with no auth on the dev doc reference page. 
However once we got that, it was a matter of parsing the returned JSON and feeding it to Column Filter configuration nodes.
Although the interface is not elegant as there is no capability to re-size or position the interface elements, i prefer this to the original interface as the selecting of dimension and metrics is a lot faster with the column search feature and selection of custom dimensions is a matter of selecting the Custom Dimension column then adding the indexes you want in the custom dimension numbers input. Less clicks, easier to edit = happy me (and hopefully you).
Unfortunately Knime as yet does not have the feature to run part of a component on initiation so fetching the metadata is not automatic. I had to move this to a separate component that you will need to drop into your workflow and connect it up the component. However there is no config or auth, so its plug and play…
For those where you may be using multiple instances of the component (multiple queries) i also uploaded a Date Selector. Basically a Calendar Interface you can use to feed the Start and end dates to the component using flow variables.
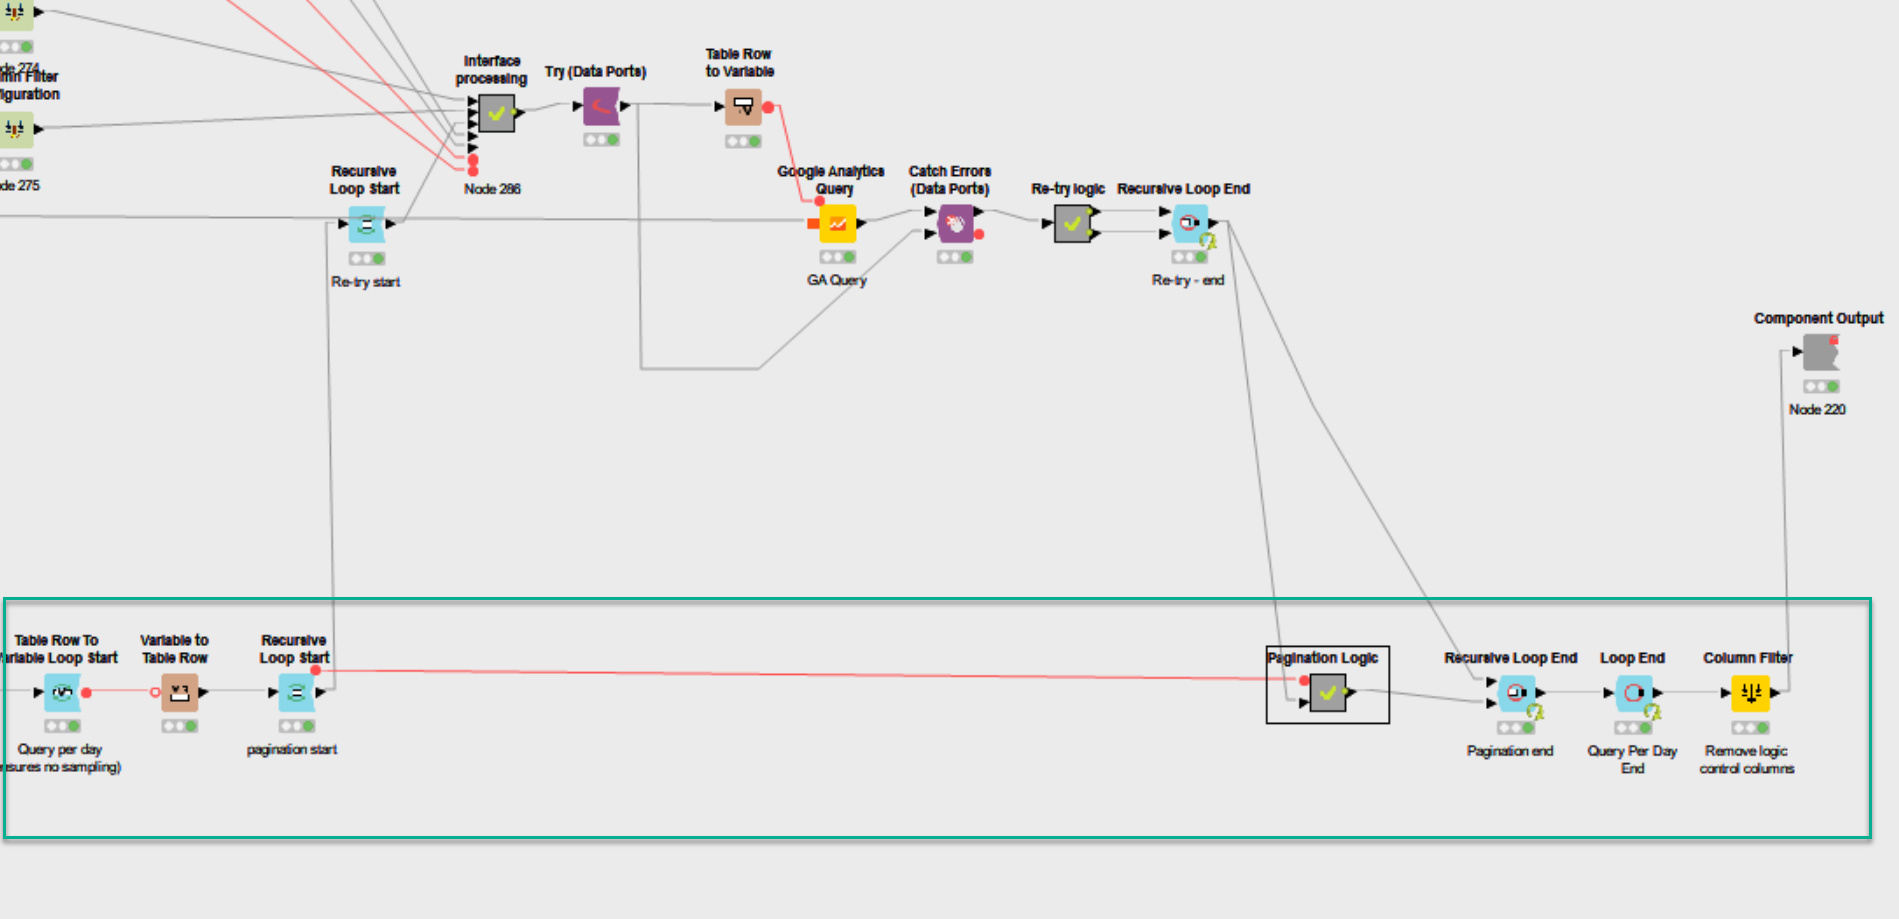
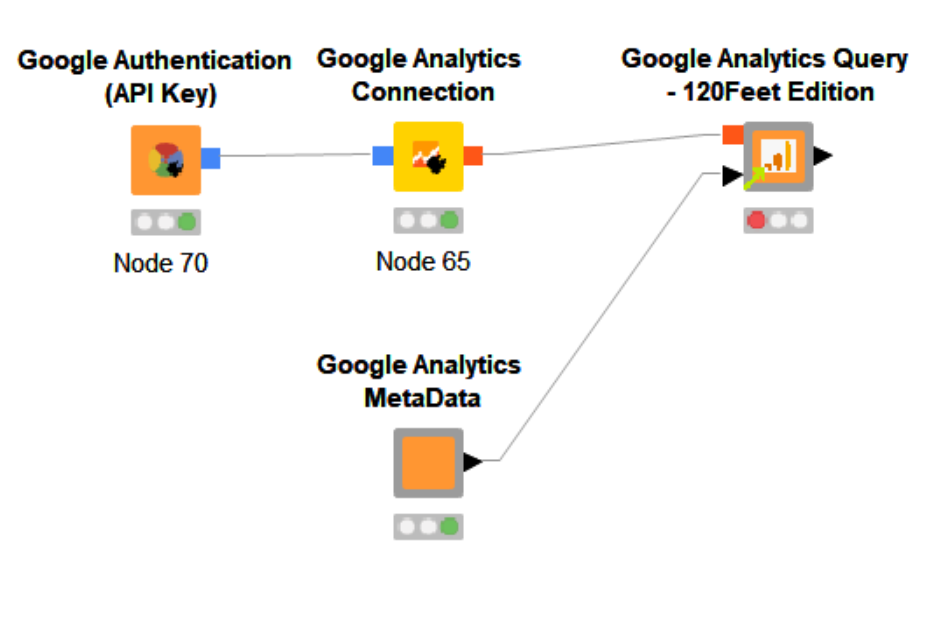
Anyhoot so there we are… Here’s the full Connection setup.
Hit me up if you have any feedback, improvements or encounter any bugs
Ciao