Hi there,
I have a little problem. I need to group together a number of rows of data based on a column1 variable, and then sum the value held in column2. How can I do this?
For example:
Col1, Col2
Obj1,23
Obj1, 45
Obj1, 63
Obj2, 12
Obj2, 35
Obj3, 98
Obj3,67
Obj3, 45
Obj3, 76
So, I need to sum all obj1 values from col2 etc., to get the following results
Col1, Col2
Obj1, 131
Obj2, 47
Obj3, 286
Thanks,
Stanage
Hi stanage,
In this case, the GroupBy node is your friend. Open the dialog, select Col1 as group column and select the option SUM for all numeric columns. Done. :-)
Regards, Thomas
Hi Thomas,
Thanks for that, the problem is now sorted (well partially), just need to group two streams together and compare. But I think I can manage this.
Stanage.
Ok, so I spoke too soon.
Now I have the group by sum, how can I merge two seperate tables based on the col1 varaible in order to compare their respective sum values (the col1 variable will be the same in both tables).
Thanks,
Stanage.
Hi again,
The Joiner node does exactly this operation. Before you put both data sources into this node, you need to make sure that the first input contains the group column as RowIDs. So please use the RowID node first to replace the RowID with the grouped column. In the Joiner dialog, you have to select the group column from the second table and you probably also need to append a suffix for duplicate column names - in case both SUM columns have the same name. Hope this helps...
Cheers, Thomas
Hi Thomas,
I always forget about the rowID node when using the joiner. The rowID node sets the col1 parameter as the new rowID, then you can use the joiner to link the tables. Can't you somehow incorporate this function into the joiner node, so that it is all in one place?
Thanks for your help,
Stanage
Hi stanage,
Well, I would refrain from integrating this functionality into the joiner node. This may be handy for the simple cases where there are unique value in the column but if they are not, the node will fail. In the RowID node you can select what to do in this case. We still try to avoid duplicating functionality (or parts of it) over nodes.
Maybe not what you wanted to hear :?
Happy weekend,
Thorsten
Hi Thor,
Thats not a real problem, but it may be useful to describe this in the help section of the node, as like I said, I had forgotten that you needed the rowID node to make this work. Otherwise, no problems.
Stanage.
Hi,
can we simply find the sum of all values in a particular column? i want to get the sum to calculate percentage frequency distribution… is there any node available in knime to calculate the same?
Hi Vermaneha,
you can use the group by node to compute the sum of all values in a particular column. If you do not specify a group by column the whole table is treated as one group.
Bye,
Tobias
Similar issue I believe…
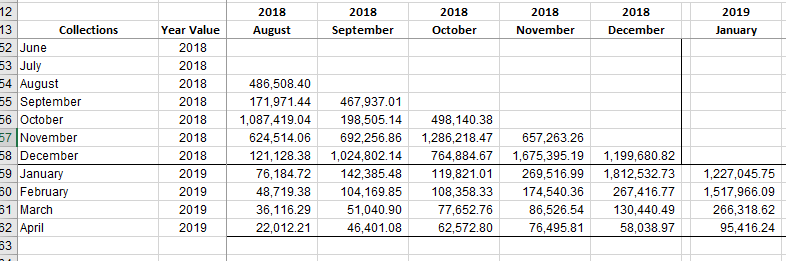
I’m attempting to build a waterfall table summarizing payments with dates of payment on the y-axis and dates of service on the x-axis. The data is already been formatted to include month and year so plan group by both ‘Payment Year’ and ‘Payment Month’ and then sum of the respective ‘Service Year’ and ‘Service Month’ on the horizontal. It’s easily done in excel pivot tables, Alteryx cross tabs, but I can’t seem to bring it to life using the Knime pivot node.
Any advice would be most appreciated!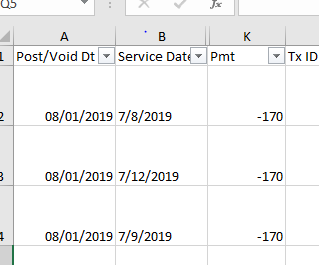
It would be helpful if you publish your data sample and work flow.
Here is a very small piece of the ~2GB dataset. Jan _ May 2019 reduced.xlsx (3.1 MB)
Also the end result of similar analysis performed using pivot tables.
3 This is the way Pivot works. Totals presented separately. You can use Concatenate and
Column Appender to join totals to the pivot body.
I tried that and have the table appear with the buckets aligned properly on both axis’, but only see values appear in the far right payment totals column. I uploaded additional screenshots of where this stands… are there any workflow examples out there that perform a similar exercise of pivot then concatenate? Thanks for all the guidance on this. I truly owe you!
pivot2.docx (296.3 KB)
Sorry for some misleading. Read Pivot node output port description below.
Output Ports
1 A table containing the totals for each defined group. That is, the aggregation for each group ignoring the pivoting groups. This table can be joined with the Pivot table; the RowIDs of both tables represent the same groups). The table will contain as many rows as there are different groups in the data and as many columns as there are selected aggregations. The table is identical to the output of a GroupBy node, in which the group and aggregation columns are chosen accordingly.|
2 A single row table containing the aggregated values of the Pivot table. The table structure is identical to the Pivot table (possibly enriched by overall totals if the “Append overall totals” is selected. This table is usually concatenated with table that results from joining the Pivot table with the Group table.|
2 Likes