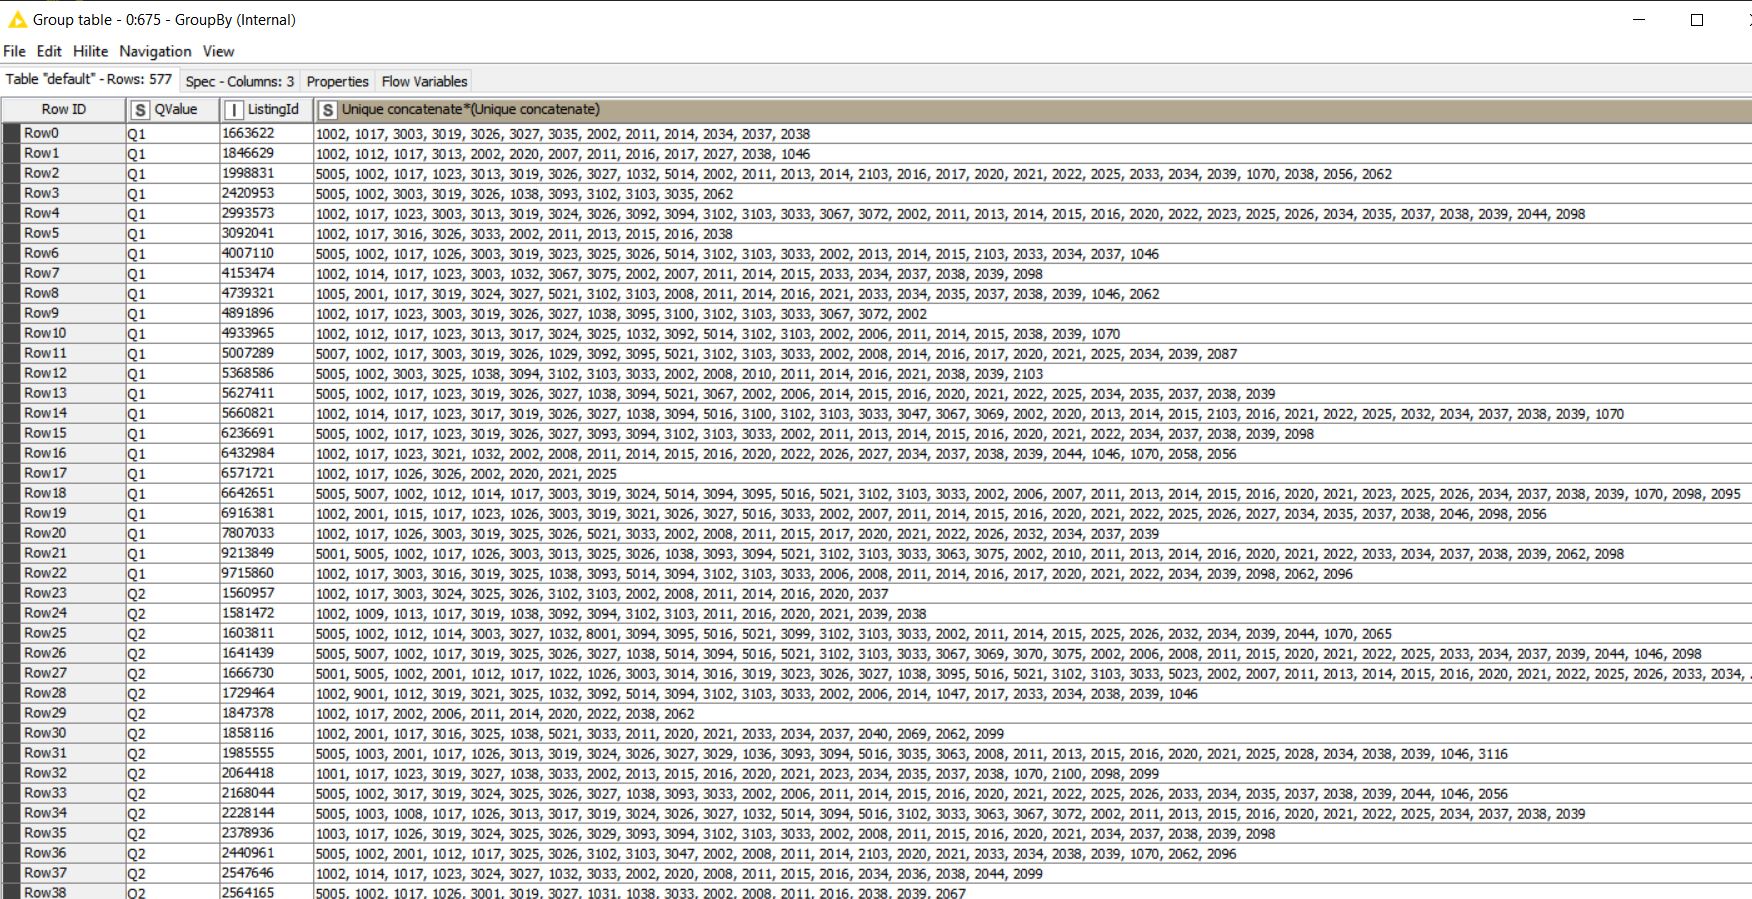
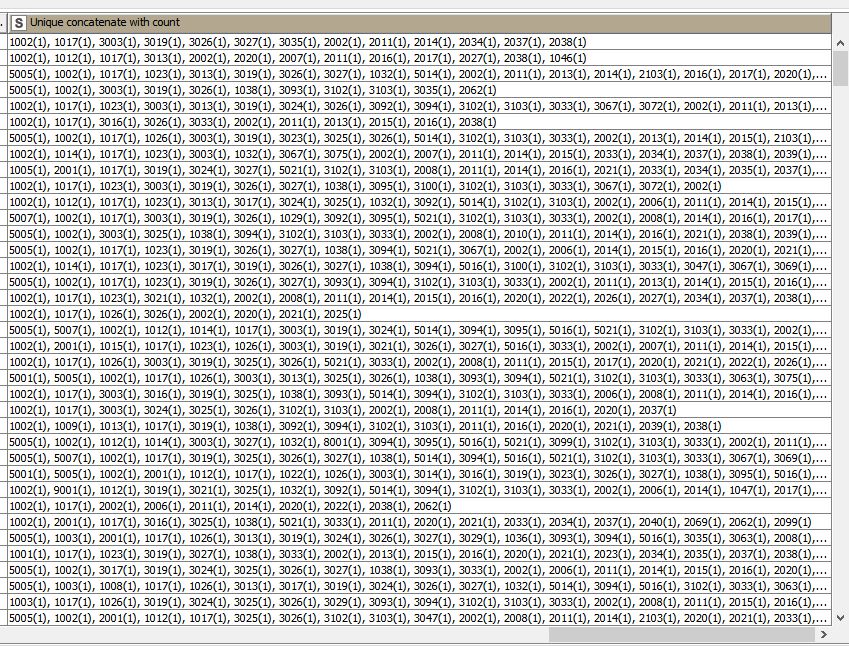
I have a column category of ListingId with 577 unique datasets. Within each of these 577 ListingId datasets are numeric Identifiers (1002, 1017, 3003, etc).
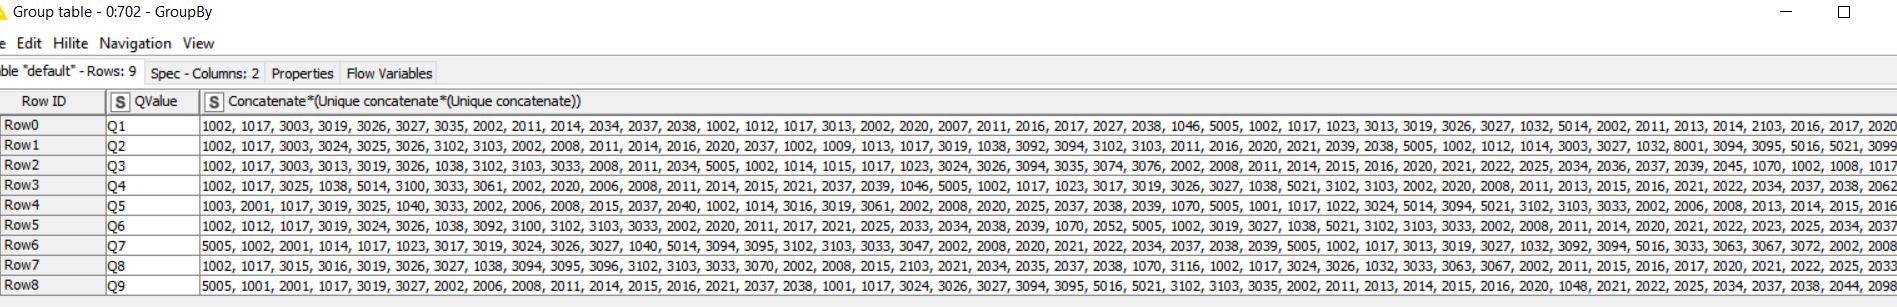
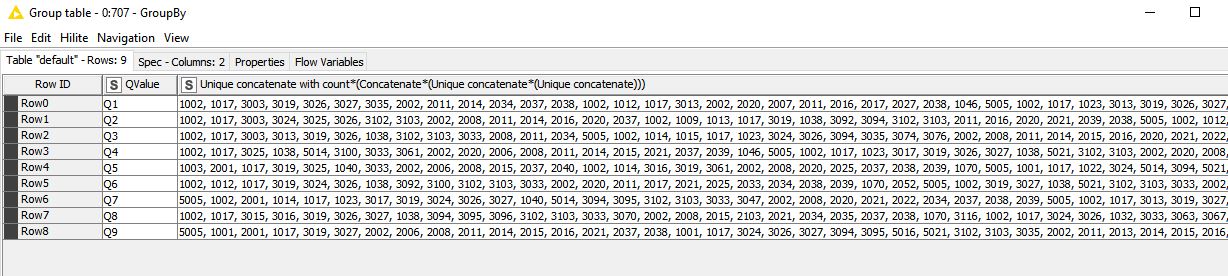
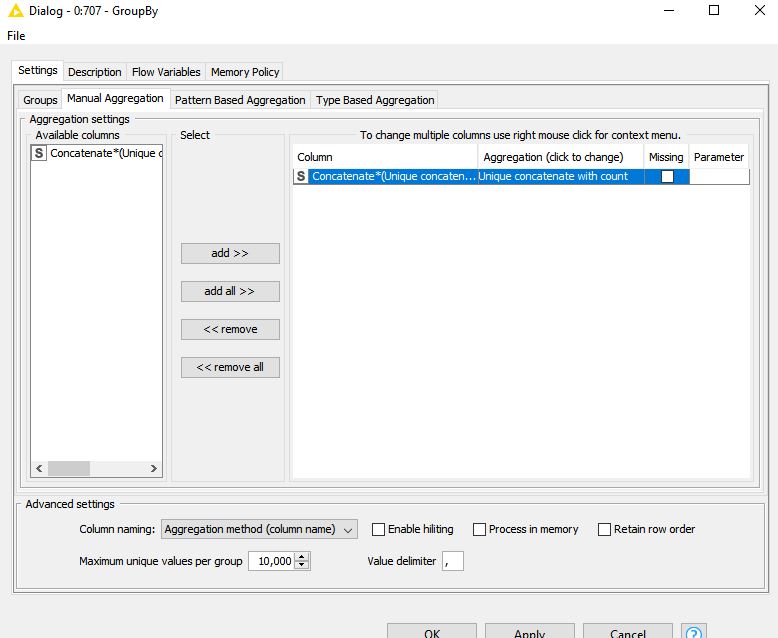
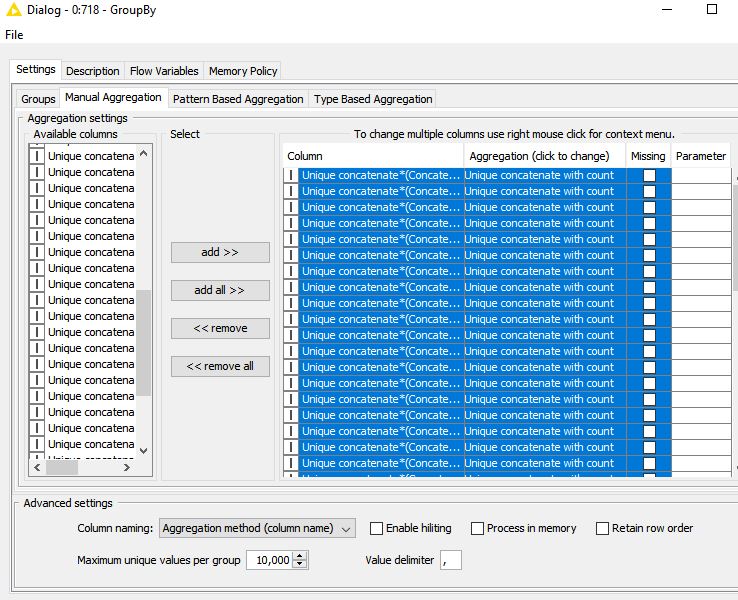
But I cannot get GroupBy, Concatenate with Count to give me the count. I can easily concatenate all the numeric identifiers into each QValue group, but I cannot get the results such as "1002(15), 1017(22), 3003(32), etc.
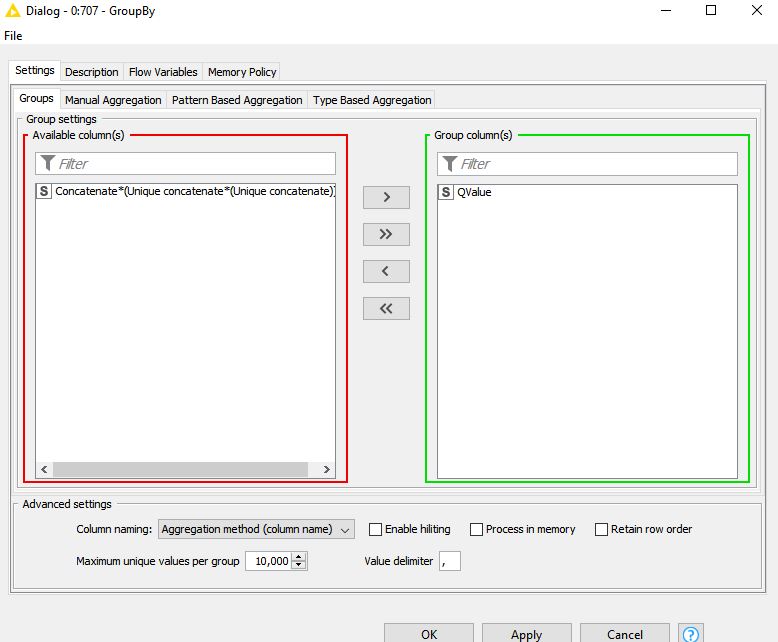
I even tried renaming the convoluted “unique concatenate*(unique concatenate)” column naming from the prior analyses incase it was creating a problem, and also saved the output to a Cache incase multiple GroupBy steps were creating a problem. Nothing seems to give me an actual concatenated count of the numeric identifiers combined within the series of QValue groups.
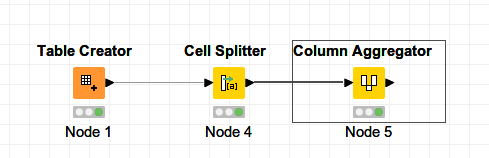
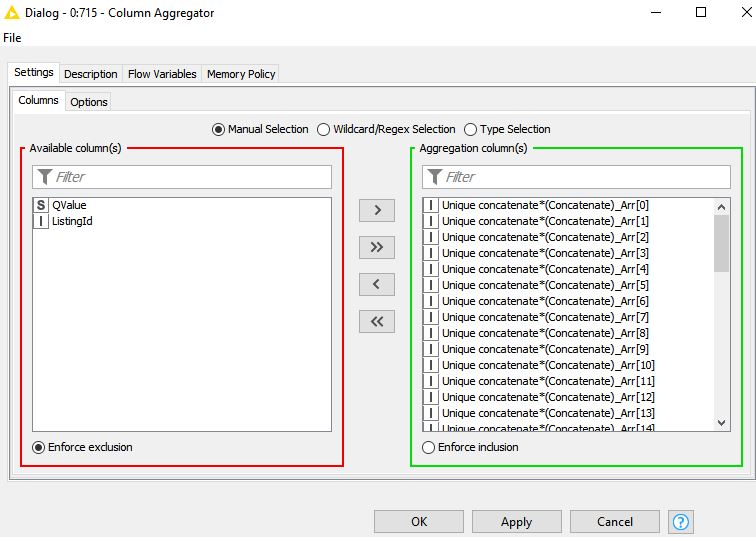
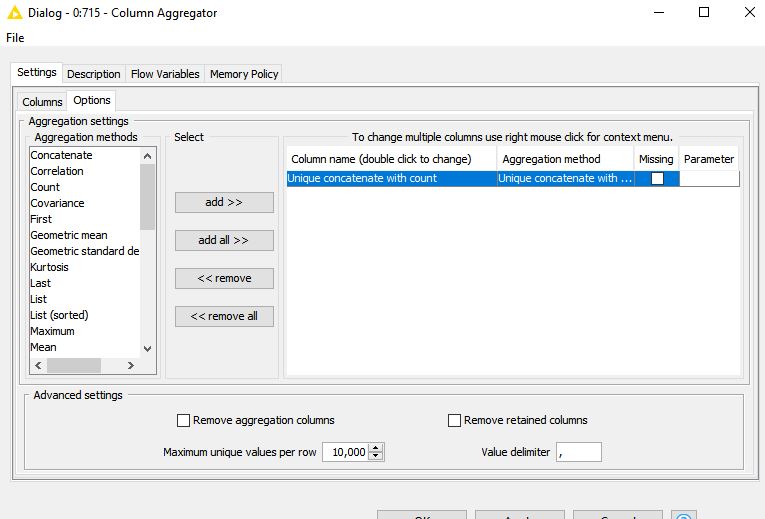
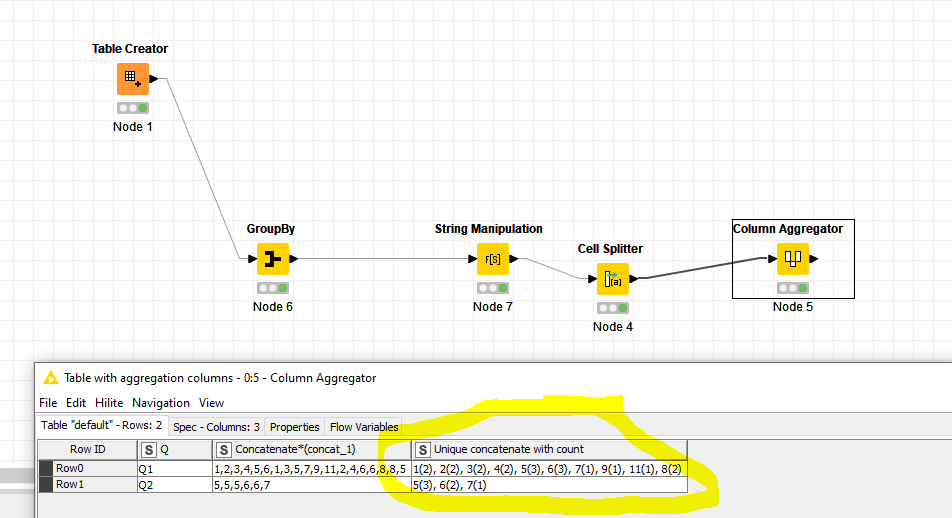
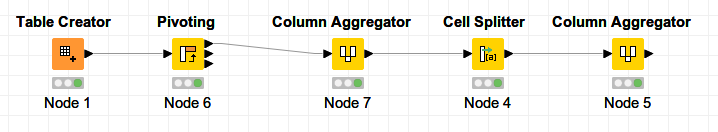
A solution is to use a Cell Splitter node to split the “unique concatenate” column. And then aggregate them again using the Column Aggregator node, there is an option : Unique concatenate with count. See this example: unique_concat_with_count.knwf (15.5 KB)
gr. Hans
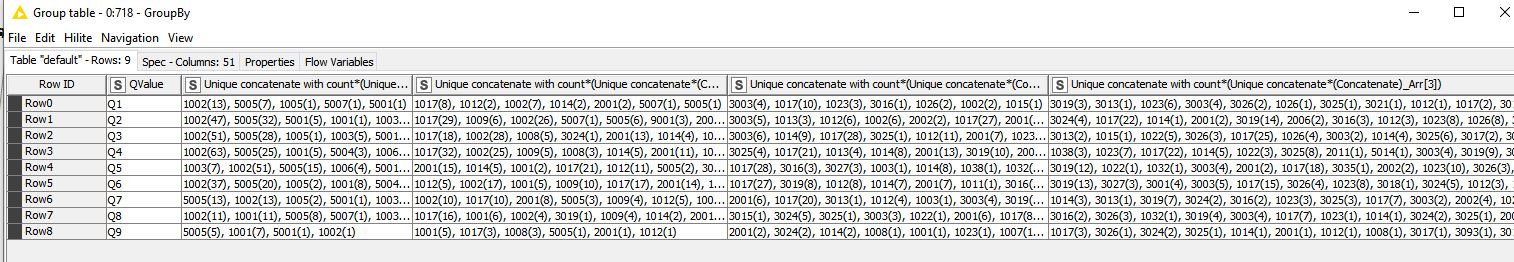
Hi Hans, here’s my set up. But I simply get a count for unique within the ListingId group–all “1’s”. I need to pull all of those into their respective “QValue” group, then perform the unique concatenate with count. I am still failing at that.
I also then attempted a GroupBy for QValue, but after splitting the column I create a problem of getting repeating values in the column arrays (for example 1017 showing up in many columns with different counts instead of a single count for the QValue.
thanks, let me run another try with this. i had experimented with the pivoting earlier, but sometimes it’s a matter of the order of the node functions that makes things come together.