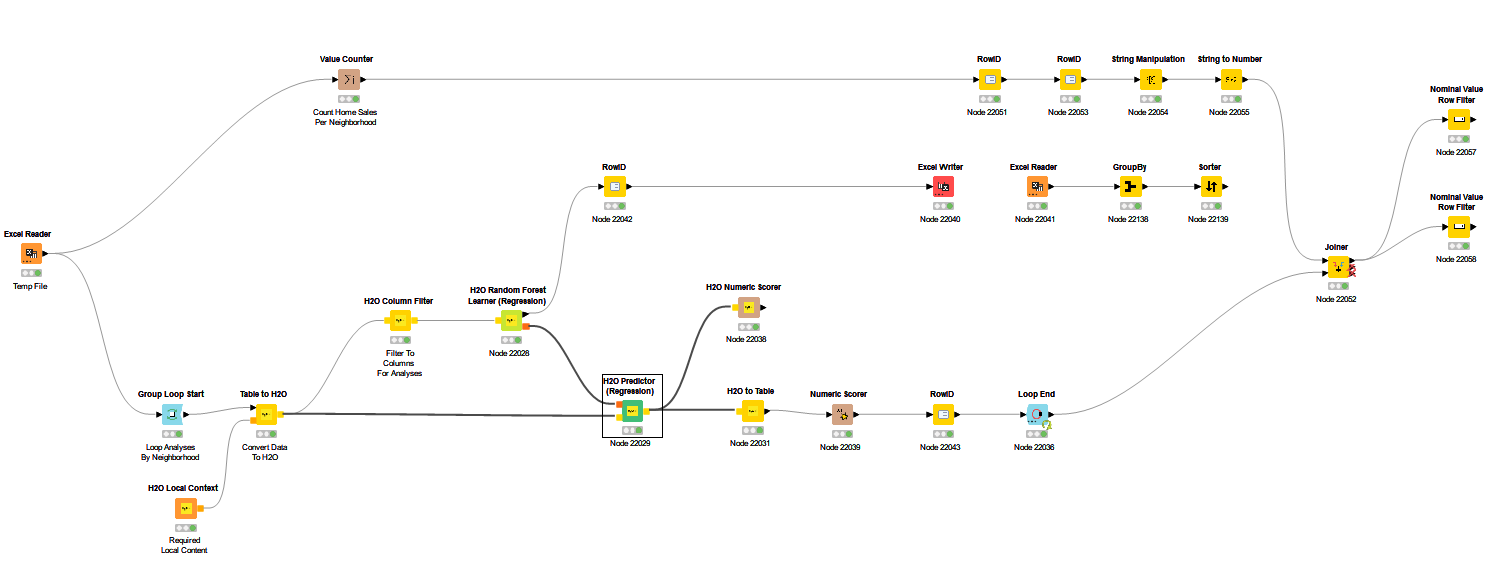
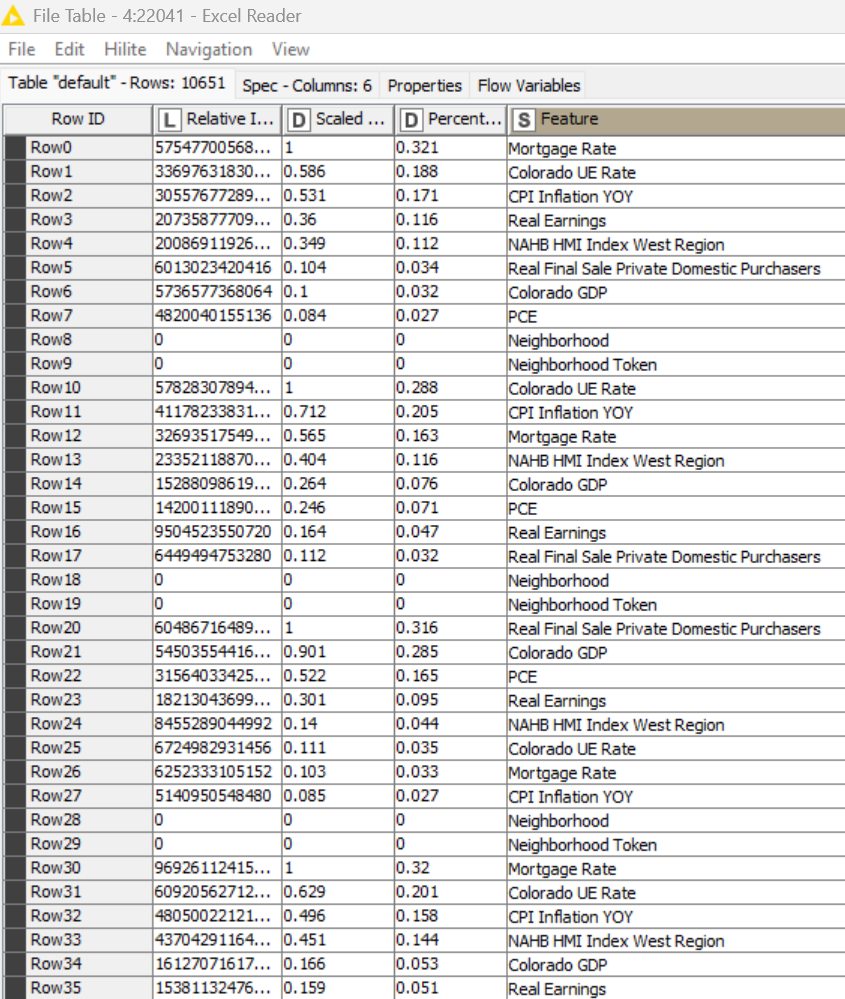
This is just on my local machine 5.4.4. I found a way to Group Loop 74 separate categories through the H2O Random Forest Regression valuation system. I can see how the valuations are indeed customized for each category and how the Variable Importance measures of the IVs adjust for each category.
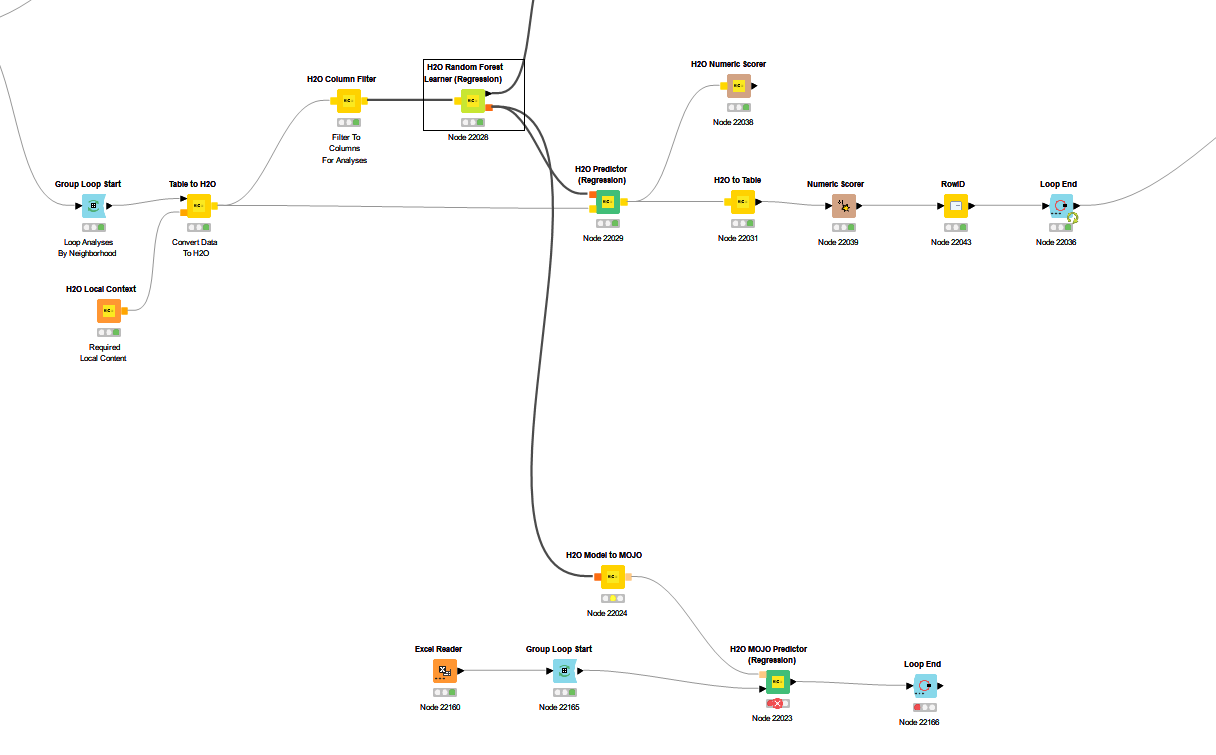
But when I try to pull forecast data into the H2O MOJO Predictor (Regression) via an Excel File, it returns the exact same predictions for every category. The previously learned and customized modeling does not seem to apply at the MOJO level.
I thought perhaps because I used a Group Loop to create the initial H2O models that Looping each category through the MOJO would work. But having a second loop blows up the system.
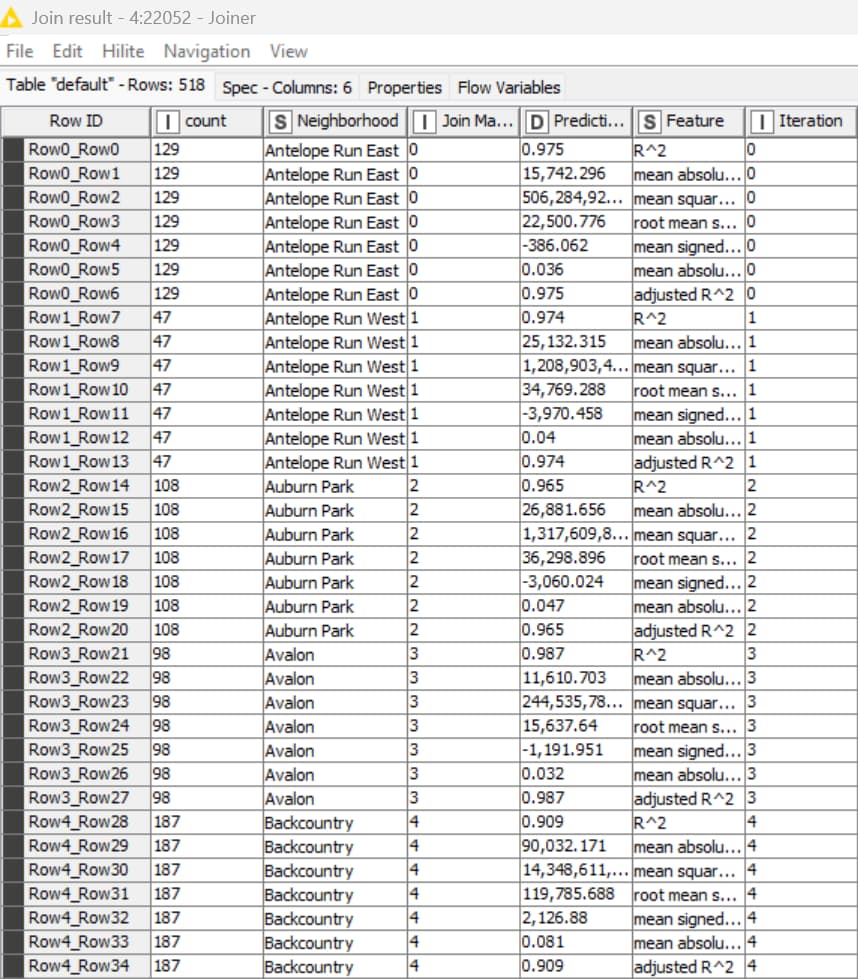
The WF and all data is attached. Thoughts: 1) Did I really create 74 unique models–the 74 different 90%+ R2 scores seem to suggest so, and the 74 different Feature Importance scores seem to suggest so; and 2) if so, how can I run each of 74 models through the MOJO one-at-a-time?
@creedssmith first you might want to think about what you want to do. Do you want 74 models for each of the items. Then you would have to store each of the models separately in the loop and later re-use them. That will result in 74 prediction scores.
You could also try to formulate the problem as a multi-class problem where you predict the correct value only once. But 74 is a lot for a multi class problem I must say. Although it always depends on your data.
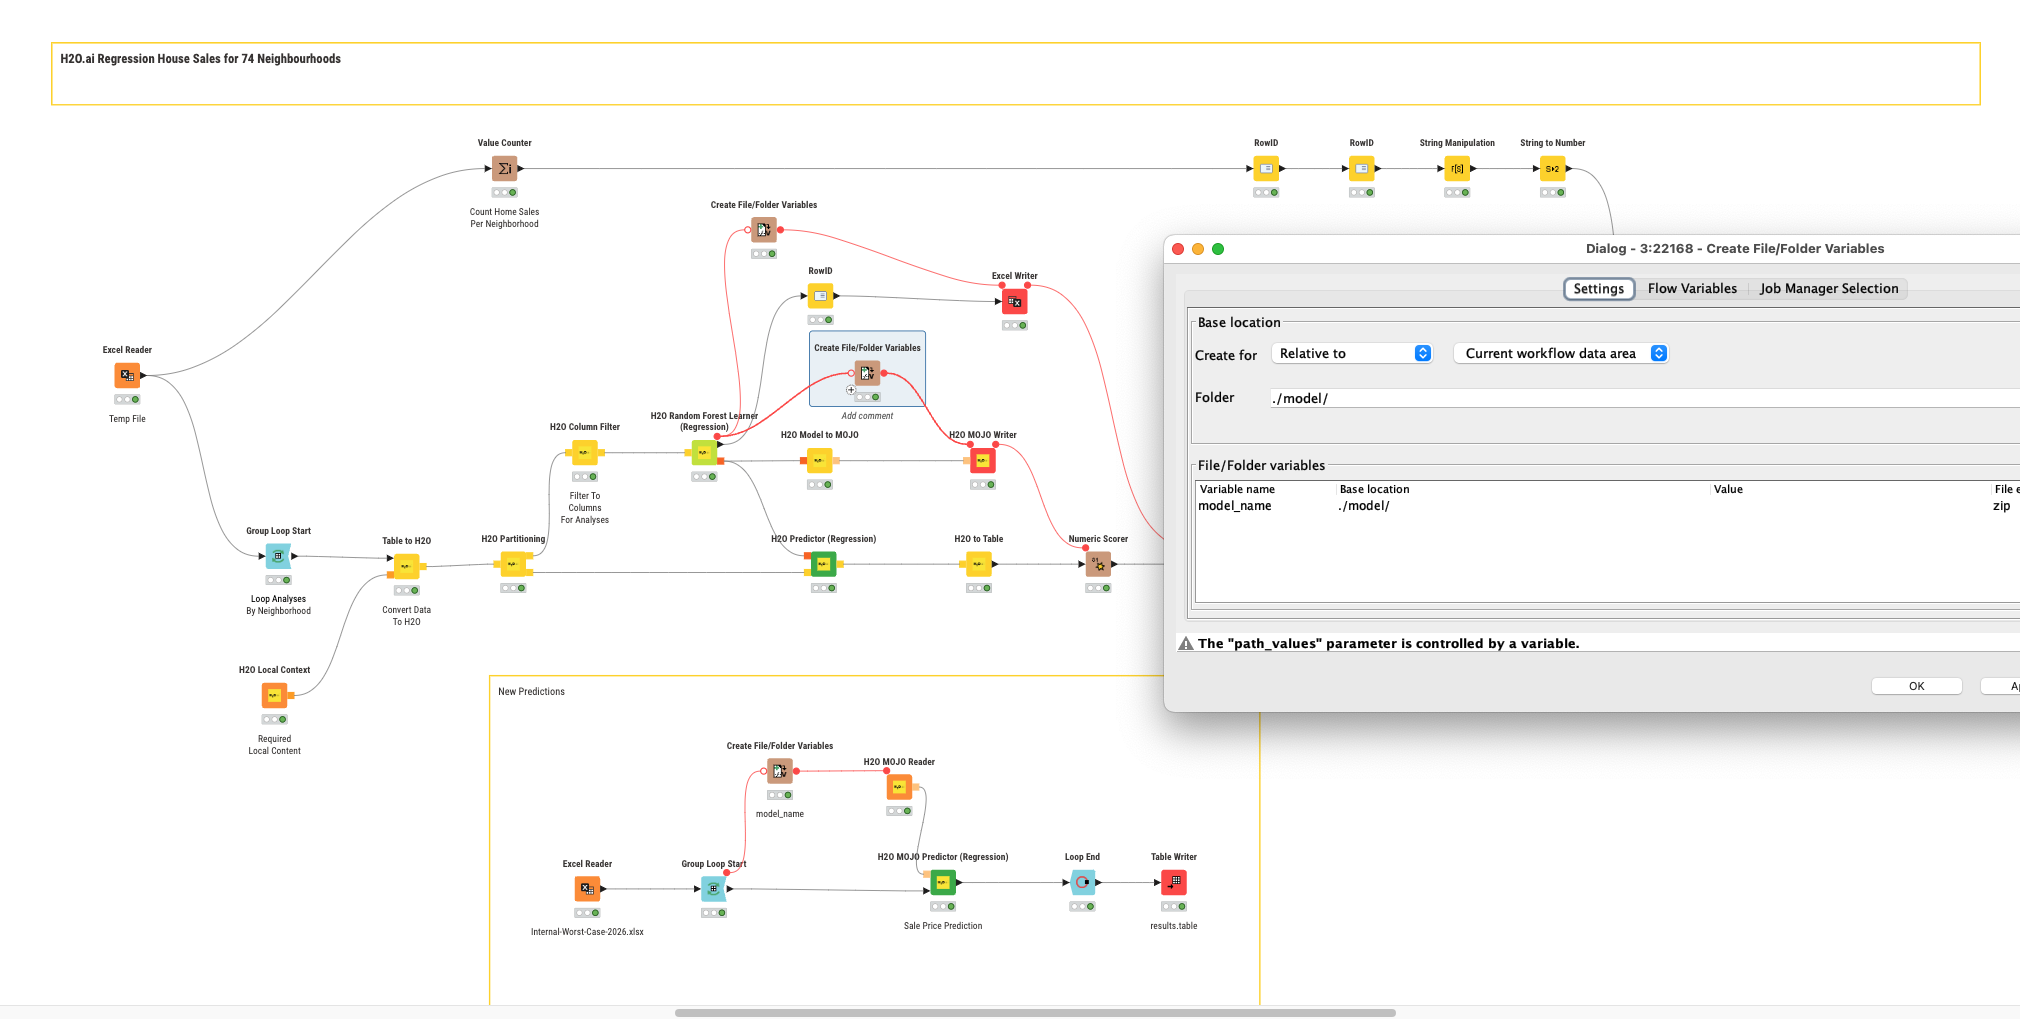
edit: OK you want a regression model for every neighbourhood. Then you will indeed have to save the models individually. I will take a look.
@creedssmith you can take a look at this example. Other H2O.ai nodes might give you even better results but some neighbourhoods do not have that much examples. Also this exercise to split them up by them will only make sense if you expect significant differences that would need individual models. A larger model might benefit from all data and maybe the neighbourhood as additional variable.
Hi @mlauber71 I’m taking a look at your WF now–hopefully I won’t hurt myself
Yes, many categories have limited numbers, but the H2O RFR worked so well in each of the 74 I really wanted to get the MOJO Predictor to work. There is substantial variance is the value ranges ($400K to $4M, along with many other features.
Initially I did try using the data in aggregate and the R2 was terrible at .24 and the prediction scores were also bad. Once I broke them into the specific 74 neighborhoods the R2 as always above .9 and the MAPE always 3.5 or less.
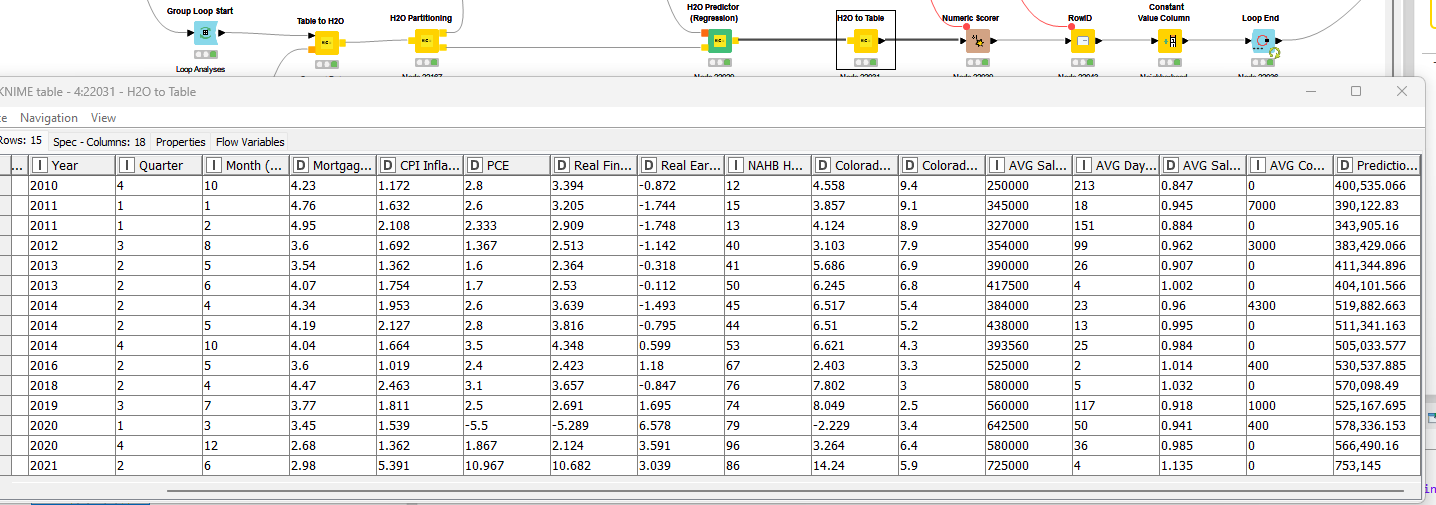
Hi @mlauber71 I was testing the output a bit and ran into a pretty big problem. The data set for each neighborhood ran 2009-2025, But the WF stopped using data in 2021. After COVID real estate nearly doubled in price here. Thus the forecasts are way low. Any thoughts on why the system stopped short of using all the data? Thanks