I’m working with some GL report data and trying to transform it so I can visualise the most common account combinations across journals, I think using a heat map (although very much open to suggestions). But I’m stuck on how to structure the data for this analysis.
“Document” header contains journals numbers and journals are broken down over multiple rows so that each account impacted in a journal gets it’s own row.
What I’m aiming to do is identify the most common combinations of accounts that appear together in journal entries. For example:
Accounts A & C appear together in 25 journals
Accounts B & D in 40
Accounts E & F in 10
My thinking is that I can then flip this logic to identify the odd journals where the combination is rarely used.
I cannot for the life of me figure out how to arrange the data to be able to identify these combinations though. If anyone has any advice it would be amazingly helpful.
Thank you in advance for any help you can provide,
Thank you for your help those are really good points that helped me think more clearly about what I need. I’ve attached a mock Excel file in the format the data comes in: Fabricated example.xlsx (15.6 KB)
I’m already using KNIME nodes like Missing Value to fill down the journal number, and Row Filter to remove totals so that gives me the core data to work with.
In the dataset I have made, the standard transaction is: Dr Debtor Cr VAT Cr Revenue
and the other combinations would be atypical.
In answer two your question I consider all the accounts involved in a journal as one combination, whether that’s two, three, or more accounts. I am fortunate that the discipline been pretty good, people don’t combine lots into a single journal so they only have necessary lines.
I have just had a little breakthrough playing with GroupBy (and concatenate therein) but I am now stuck on how to standardise the combinations (for example, if the user posted the credits first, the account order is different and so doesn’t match what should be the same combination).
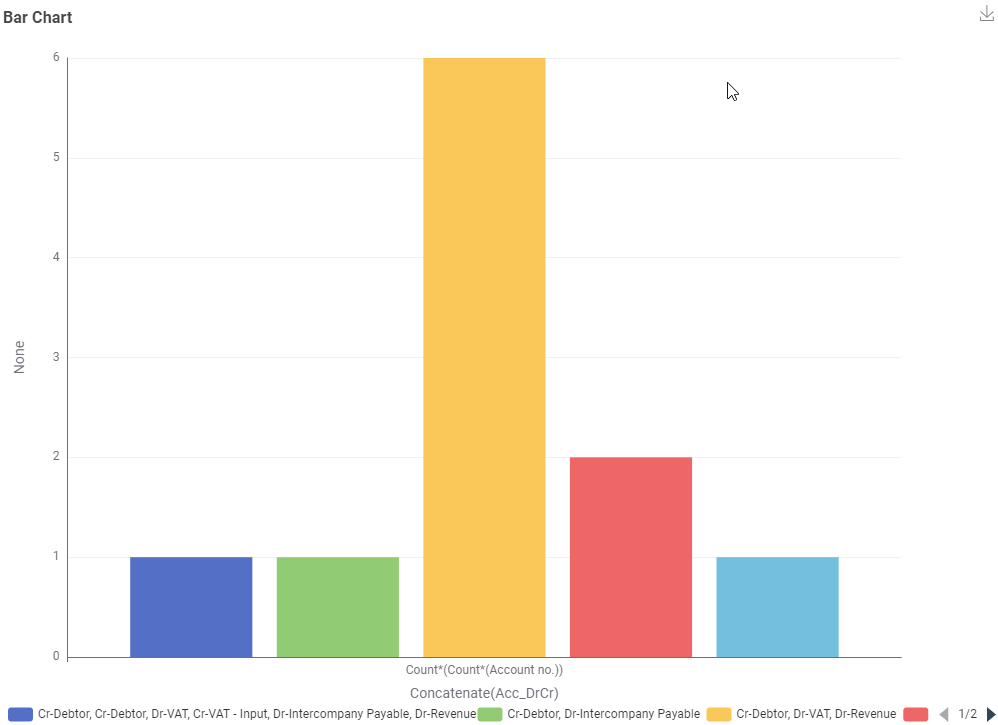
apologies for the delay in getting back to you. I had a stab at this using the example data set and to be honest I think that to answer the question which combinations appear often / not so often a bar chart may suffice.
So I determined per journal the accounting combinations (including whether it was Dr or Cr) and the wrangled the data set that I have the count of each unique combination - here’s a preview of the bar chart: