Hi there,
I just started to have my first KNIME workflow and I would like to use it to visualize data from our drug screen, where test several molecules against different protein variants.
I started based on an example I hear off the first time I was introduced to knime (attached workflow “Solution”), however I am having troubles with the heatmap and clustering.
I would like to ask for your help on how to:
Have the results on the heatmap clustered by the compound effect, so that the order of the compounds matches the clustering (for some reason my node is not doing it and it even seems that sometimes it is changing the values as it wants to). I would also like to cluster the protein variants together based on their responses (if it is necessary, it would be OK to have it in 2 different heatmaps).
I would also like to have 2 other heatmaps shown, where the protein variants are organized by residual expression and responsiveness, information on the last table (Clustering info). If I could have all 3-4 heatmaps in the same interactive visualization that would be great.
Final question, in the interactive data visualization, there is a red line that one can use to set a threshold. What exactly does it do, or can it do? because it does not seem to change anything if I move it.
It would be great if you can help me.
Thank you very much in advance.
MB
Solution.knwf (1.8 MB) Ex_WF_DD_Forum.knwf (832.7 KB)
Hi Madalena,
Welcome to the forum and the KNIME community!
Let me try to help you. So I checked your example worklfow and I think I managed to correct the sorting. In the Activity Clustering Component is the the Dendrogram and Heatmap component that contains a sorter node. I selected there the Clustering column and now it looks better. What I also did is adding a Normalizer upfront to get a better picture.
I checked also the values. I did not find any examples where the values were changed.
What I don’t really get is the other part of your question with the protein variants organized by residual expression and responsivnes. Could you share here some more input, I guess the data needs to be joined first to your initial compound table right?
once you get this done and connect the heatmap component I can show you how to bring all three together into one interactive view.
Ex_WF_DD_Forum.knwf (83.2 KB)
Best,
Martyna
3 Likes
Dear Martyna,
Thank you very very much for your help. Each step is important to me. Please allow me to ask some questions before answering yours.
-
The clustering seems to work better now. This is great. But when I try with different data, it seems not to work again. I went over the configuration of the nodes to see if everything looks the same and it does. Just the names of the molecules and variants, and the results are different. What do you think could be the problem here? The clustering in the dendogram seems to work, but not on the heatmap.
-
I would also like to ask if we could somehow allow it to present the results in the dendogram (mostly everywhere) when there are missing values, because when there is a missing value I think it is not showing it and I am afraid it is also considering for clustering?
-
Would it be possible that it clusters, no only compounds, but compounds and variants?
Answering your question, what I would like is to have then 2 more heatmaps, where the compounds are clustered together, but the variants are ordered based on information of this extra table. For examples responsive variants would be all together. And you are right, I may have to add the information to the main table, I was not sure if this would be the way because they would then be information of the columns and not the rows´.
Once again,
Thank you very much for your help. 
Best,
Madalena
1 Like
Hi Madalena,
sorry for my late reply, I was not available for some days.
-
Did you check the sorter node that is hidden in the Activity clustering -> Dendrogram and Heatmap component? Those are not usual nodes (even if they look like) and you can enter them by pressing Ctrl+double click with your mouse (if you know this, please ignore the comment). The sorter node was the one when I had previously to correct the workflow too, so maybe this will solve the problem. If this is not - I have no idea how to help without seeing the data. Are you getting an error message in the Console below?
-
With respect to missing values this is already restricted in the Hierarchical Clustering. There is a checkbox that filters missing values and those entries will be not considered for the clustering. If you uncheck the box you will get an error whenever there are missing values - which has the goal to inform the user. There is no way to do clustering with this node including the missing values entries.
-
I don’t know. I would need to play a bit with this.
Regarding additional heatmaps:
I tried quickly but it worked only for the residual expression column. The Responsiveness Column has been ignored due to the fact that it’s a string and not a numerical value. It you can change it to numerical values, I think this should take it automatically in as well. You only need to change the sorter node, so it sorts according to another column then.
It is currently also taking the Responsiveness column into the clustering, is this what you wanted? if not, I am not sure how to do it at the moment. But maybe I am just not expert enough in this area.
Ex_WF_DD_Forum.knwf (119.6 KB)
I will try to answer faster next time! sorry again.
Best,
Martyna
2 Likes
Dear Martyna,
Thank you for all your help. If you allow be, I will just try to go step by step. Regarding you answer to my first problem (1.) about the lost clustering in the heatmap. Yes, I checked inside the hidden nodes, but I am not finding the problem. I was trying to understand each node a little better and what I can say is that when I right-click on the heatmap node and click the output table, in the output table the clusters are there, and the sorting is correct (sorted by cluster), but when right click and select the interactive view, the heatmap is there but with the compounds sorted in the original order (not clustered). Where could the problem be? It seems like it has to be inside this node (heatmap).
Thank you.
Madalena
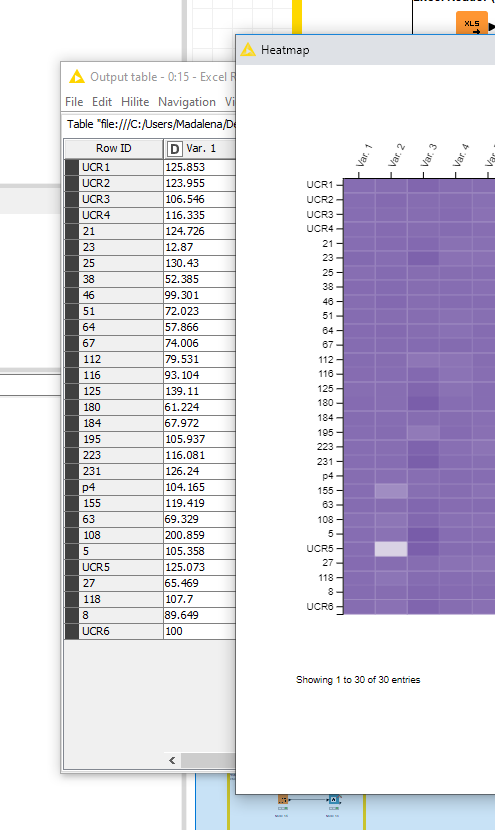
Actually, I just found out, the heatmap is completely correct and “clustered” but the labeling on the left side is wrong. The compounds are there in the original order and in the order set after clustering and therefore they are not matching the content of the heatmap! This is why I previously saw/mentioned the results changing, now I know why. But I don’t know how to fix it. In the output table the sorting is all correct.
Thank you.
Madalena
TestHeatmapProblem.knwf (68.8 KB)
Madalena Barroso
Dear @Martyna,
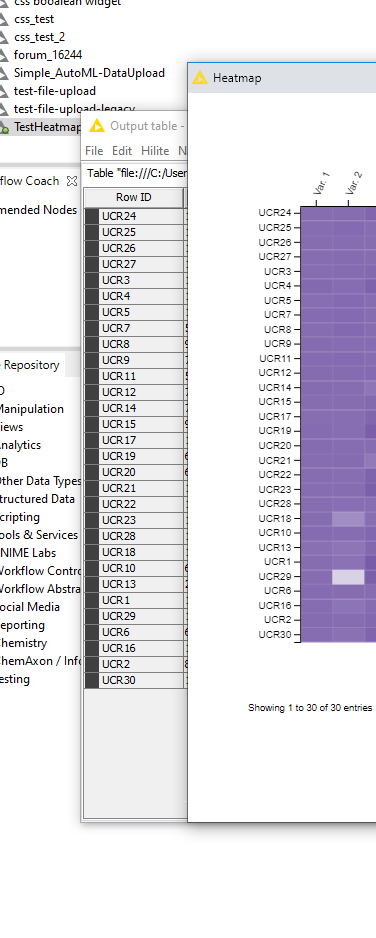
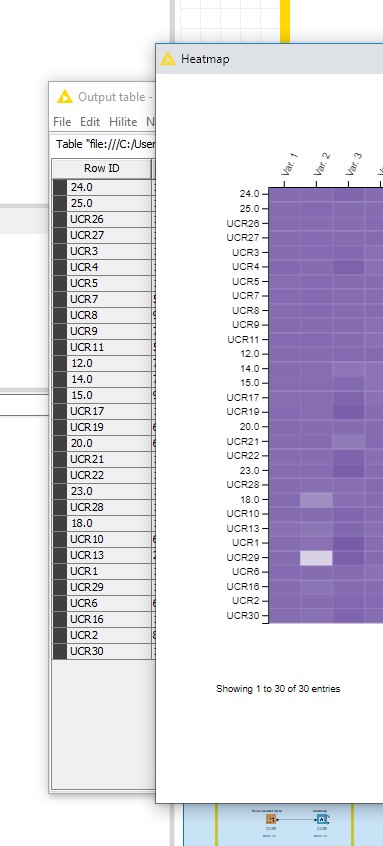
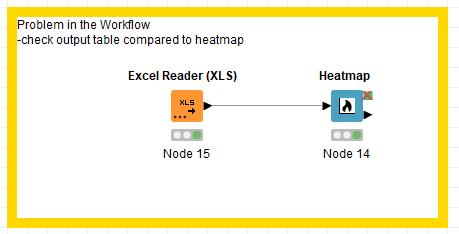
In order to shorten the problem I created the workflow attached. I think this helps to understand my first problem.
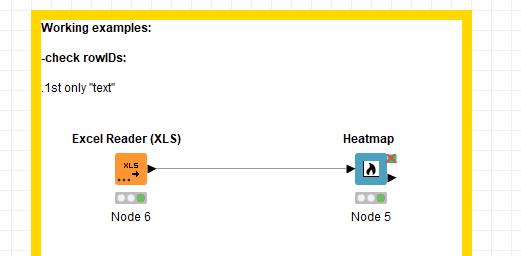
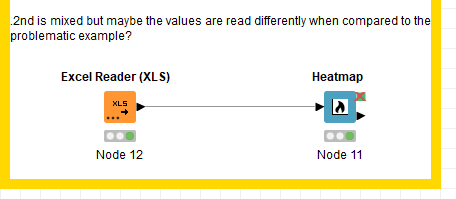
It seems like the problem is the type of entry in the RowID given for the heatmap. When I use text and numbers, the node separates those into 2 groups in the heatmap and disregards the information from the table (output table different from heatmap as mentioned before).
It seems like a bug in the node. I hope you can help fixing it or that you are able to tell me a way to circunvent this issue.
Thank you very much. I am looking forward to hearing from you.
Best,
Madalena
Hi Madalena,
thanks for sharing the example, now I got what you mean. I will look into it a bit more and investigate. Let’s see if we oversee something or if this is a bug that needs to be fixed.
Best,
Martyna
1 Like
Hi Madalena,
It seems to be a bug, that the node sorts Row Ids that are integer values. I created a ticket for that.
In the meantime I would recommend to use Row Ids that don’t cause those issues.
Thanks for digging into this problem and providing the example workflow!
Best,
Martyna
2 Likes
In the next bug fix of KNIME Analytics Platform (4.2.2 coming out soon) this should be fixed so that your workflow looks as follows:
2 Likes