Hello,
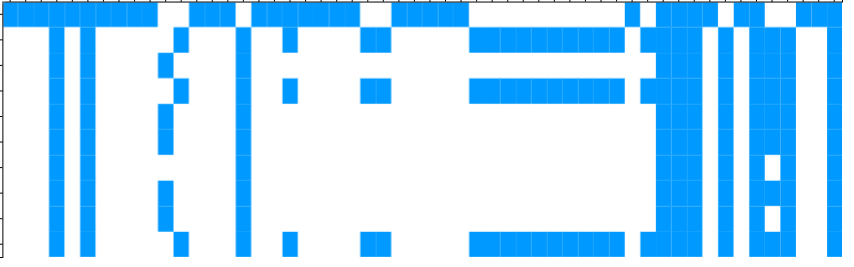
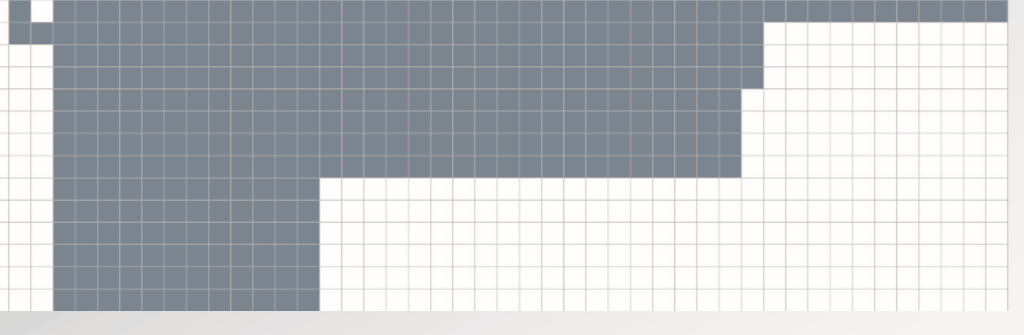
I have successfully made a heatmap. As it only has two colours (true/false) it is hard to read. I was wondering if I can change the colour of the lines between the rows and columns. I would hate to have to make the white boxes dark. I’m aware that one can edit the appearance with the CSS Editor node, however I haven’t figured out how to change the line colour.
I have attached an image of what I have and what I would prefer to have.
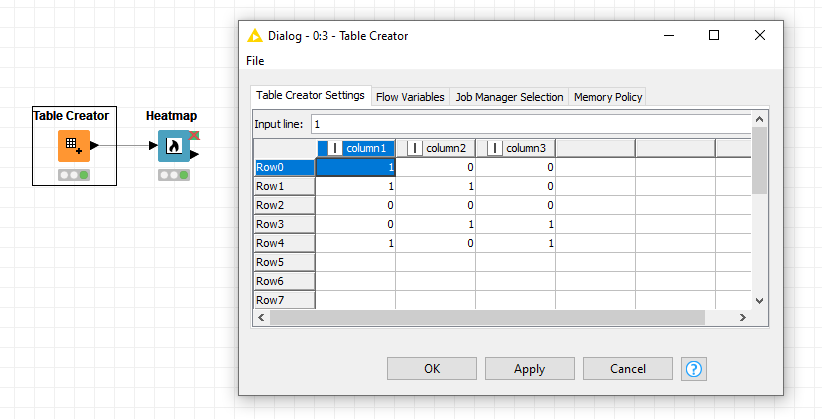
To get a picture that is sorted like your second ones you would probably need to sort the data before or try some clustering like hierarchical clustering for example.
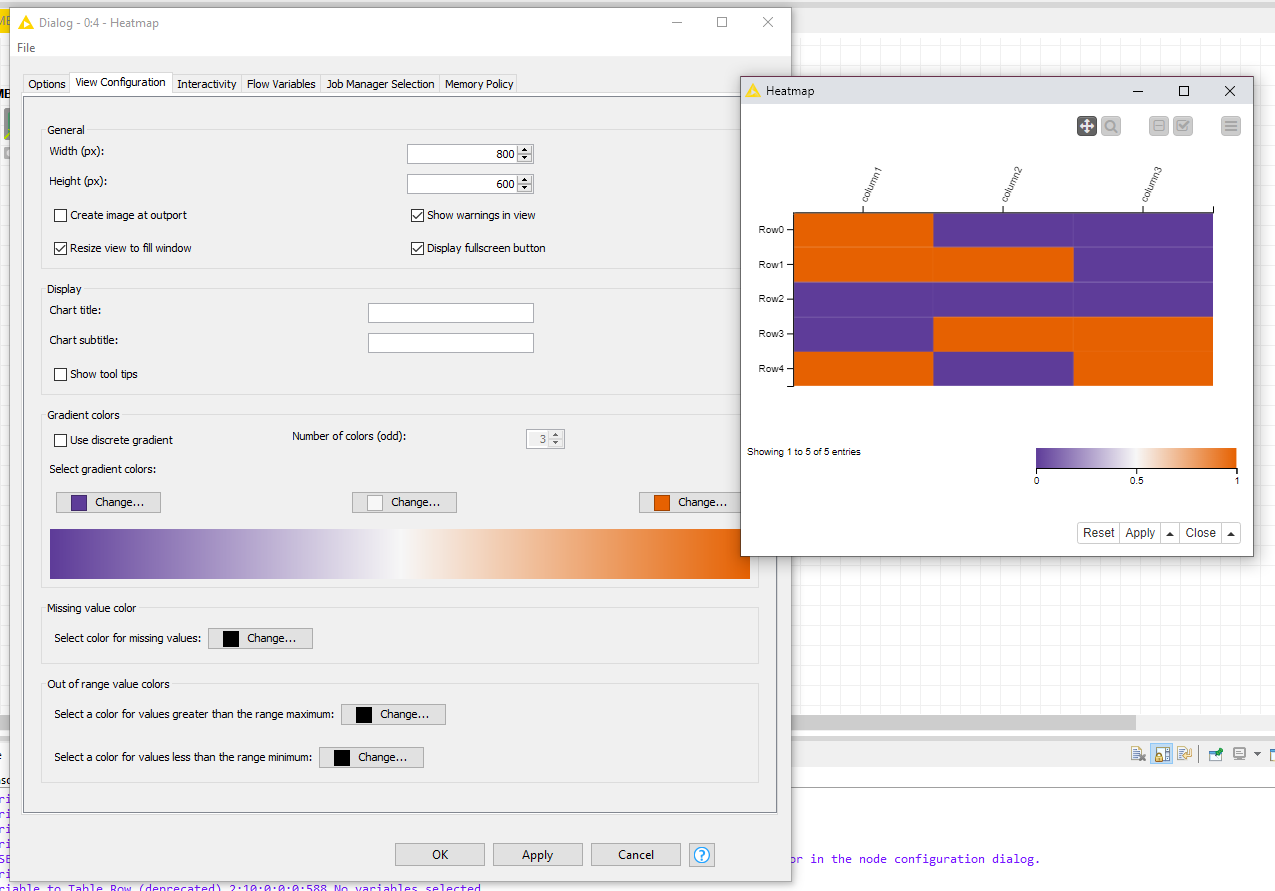
Thank you for your kind suggestion. However this does not solve my problem. I still find it very hard to read the table and would prefer to change the colour of the lines if possible.