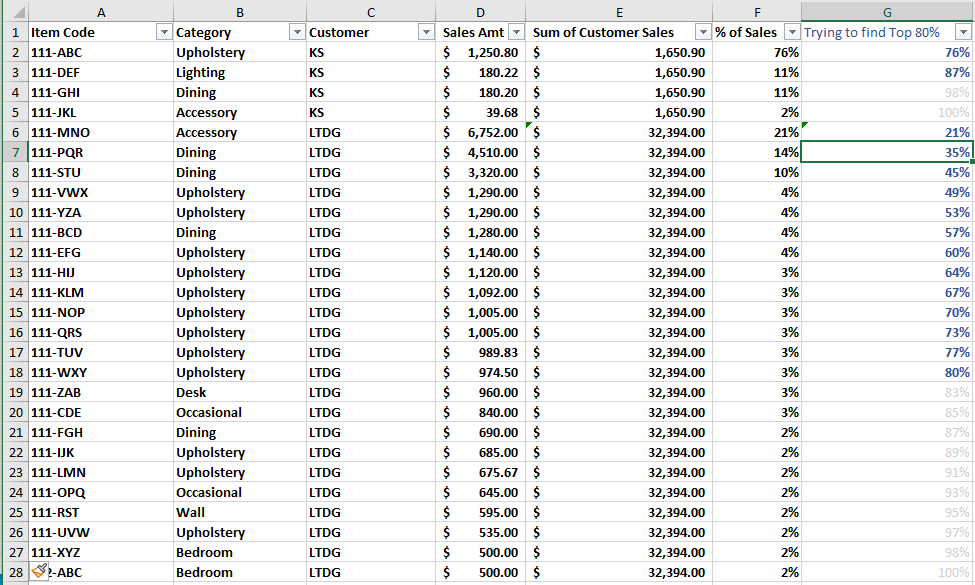
So I do not know exactly how I would do this in KNIME or even Excel, but I feel like KNIME must have a way to do what I am looking for. I have a table of sales data, grouped by customer, so that for all the different customers, I can see all the items they have bought recently and how much of each customer’s total sales each product represents. I would like to generate for each customer a list of all the items that generate at least 80% of that customer’s sales, which you can see represented by the bold rows in column G (this column is taking the sum of % of sales by adding % to the previous row, so cell G7 is 21% + 14%, and so on). For example, for customer KS I would only want to list the first 2 items in their sales, while Customer LTDG would have 13 items that make 80% of their sales. Is there anyway to count for each customer the sales until you have counted enough items to cover 80% of revenue and isolate this list from the rest? Please let me know if I can clarify what I need
Hello @ekent ,
as I understood, you are trying to make something close to an ABC analysis, right?
Here’s what I have made for you, tell me if it’s useful or corrections have to be made.
Remember to mark the post as solved if your problem is resolved ![]()
PS: for future requests on the forum, always remember to attach some data in tabular form (Excel, csv, whatever).
Have a nice day,
Raffaello
Hi @ekent ,
As @lelloba has demonstrated, the grouped “cumulative” calculation in KNIME generally requires a moving aggregation to be placed within a group loop.
As the calculation of cumulative sales, or percentages is quite a common requirement, I have written it into a java snippet and “componentized” it.
There are two variations:
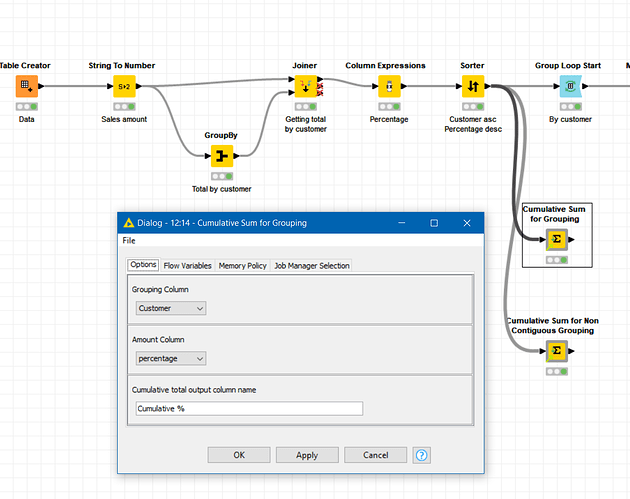
If there are no gaps/breaks for a given “grouping” within your data, so that as in your example you have all of one customer’s rows followed by all of anothers, you can use the “Cumulative Sum for Grouping” component, which has lower demand on memory.
Where different customers’ rows of data are interleaved, and you don’t want to have to re-order them, or if your data set is relatively small, you can use the “Cumulative Sum for Non Contiguous Grouping” component:
Dropping them into the workflow that @lelloba has kindly uploaded, they could go here, for example:
and can quickly create the cumulative % column for you
This topic was automatically closed 90 days after the last reply. New replies are no longer allowed.


