Help with Generic JavaScript node

Im new in Knime and Java.

Im trying to make a animated graph in a Generic JavaScript node. I have been successfully coded (the results are what is expected, but i think it can be better coded.

For example:

To get the information from the previews node, we used:

var h1= knimeDataTable.getColumn(1);
var h2= knimeDataTable.getColumn(2);
var h3= knimeDataTable.getColumn(3);
var h4= knimeDataTable.getColumn(4);
var h5= knimeDataTable.getColumn(5);
.
.
.
var h55= knimeDataTable.getColumn(55);
var h56= knimeDataTable.getColumn(56);
var h57= knimeDataTable.getColumn(57);
var h58= knimeDataTable.getColumn(58);
var h59= knimeDataTable.getColumn(59);
var h60= knimeDataTable.getColumn(60);

Then, we substitute all of previews code for this next one:

for (var i = 1; i < 61; i++) {
this[“h”+i] = knimeDataTable.getColumn(i);
}

And is working right !.

We want to do the same with the next part of the code:

steps: [
{label: n[1], method: ‘animate’, args: [[n[1]], { mode: ‘immediate’, frame: {redraw: false, duration: 500}, transition: {duration: 500} }]},
{label: n[2], method: ‘animate’, args: [[n[2]], { mode: ‘immediate’, frame: {redraw: false, duration: 500}, transition: {duration: 500} }]},
{label: n[3], method: ‘animate’, args: [[n[3]], { mode: ‘immediate’, frame: {redraw: false, duration: 500}, transition: {duration: 500} }]},
{label: n[4], method: ‘animate’, args: [[n[4]], { mode: ‘immediate’, frame: {redraw: false, duration: 500}, transition: {duration: 500} }]},
{label: n[5], method: ‘animate’, args: [[n[5]], { mode: ‘immediate’, frame: {redraw: false, duration: 500}, transition: {duration: 500} }]},
.
.
.
{label: n[55], method: ‘animate’, args: [[n[55]], { mode: ‘immediate’, frame: {redraw: false, duration: 500}, transition: {duration: 500} }]},
{label: n[56], method: ‘animate’, args: [[n[56]], { mode: ‘immediate’, frame: {redraw: false, duration: 500}, transition: {duration: 500} }]},
{label: n[57], method: ‘animate’, args: [[n[57]], { mode: ‘immediate’, frame: {redraw: false, duration: 500}, transition: {duration: 500} }]},
{label: n[58], method: ‘animate’, args: [[n[58]], { mode: ‘immediate’, frame: {redraw: false, duration: 500}, transition: {duration: 500} }]},
{label: n[59], method: ‘animate’, args: [[n[59]], { mode: ‘immediate’, frame: {redraw: false, duration: 500}, transition: {duration: 500} }]},
{label: n[60], method: ‘animate’, args: [[n[60]], { mode: ‘immediate’, frame: {redraw: false, duration: 500}, transition: {duration: 500} }]},
]

and this part of the code:

frames:[
{name: n[1], data: [{ y: h1, marker: {color: c1, size: s0}}]},
{name: n[2], data: [{ y: h2, marker: {color: c2, size: s0}}]},
{name: n[3], data: [{ y: h3, marker: {color: c3, size: s0}}]},
{name: n[4], data: [{ y: h4, marker: {color: c4, size: s0}}]},
{name: n[5], data: [{ y: h5, marker: {color: c5, size: s0}}]},
.
.
.
{name: n[55], data: [{ y: h55, marker: {color: c55, size: s0}}]},
{name: n[56], data: [{ y: h56, marker: {color: c56, size: s0}}]},
{name: n[57], data: [{ y: h57, marker: {color: c57, size: s0}}]},
{name: n[58], data: [{ y: h58, marker: {color: c58, size: s0}}]},
{name: n[59], data: [{ y: h59, marker: {color: c59, size: s0}}]},
{name: n[60], data: [{ y: h60, marker: {color: c60, size: s0}}]},
]

we thought that something like the following code would work, but not:

for (var i = 1; i < 61; i++) {
{name: n[i], data: [{ y: h[i], marker: {color: c[1], size: s0}}]},
}

or:

for (var i = 1; i < 61; i++) {
{label: n[i], method: ‘animate’, args: [[n[i]], { mode: ‘immediate’, frame: {redraw: false, duration: 500}, transition: {duration: 500} }]},
}

Can somebody helpme to put all this codes inside a loop?

The workflow is this one. Please check it and help me,Schedule.knwf (9.9 KB)
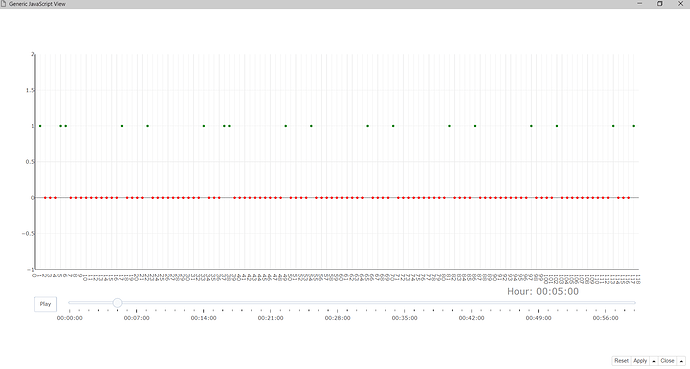
Hello @jodomofo -

Sorry for the delayed response. We have some folks that are very good with javascript visualizations, but unfortunately I don’t fit the bill :slight_smile:

Let me see if I can point their attention to this thread.

hi @jodomofo

i tried to look into your code
i see that your trying to implement a plotly visualization
inside of the Generic JavaScript Node
that is great!

anyway without the data it is hard to debug this

I also would like to know what kind of animated plot you are trying to create!
is it a line plot made of dots that animates with time?
is the plotly code coming from a public repository or is it your own code?
link any sources please!

did you try already with the following approach?

var n=knimeDataTable.getColumnNames();

for (var i = 1; i < 61; i++) {
this[“h”+i] = knimeDataTable.getColumn(i);
this[“c”+i] = knimeDataTable.getColumn(60+i);

var current_n = this[“n”+i];
var current_args = new Array();
var sub_obj = { mode: ‘immediate’, frame: {redraw: false, duration: 500}, transition: {duration: 500} };

current_args.push([current_n]);
current_args.push(sub_obj);

var sub_array = new Object(),
label = current_n,
method = ‘animate’,
args = current_args;

auto_steps.push(sub_array);
}

then you can add the array later on to the plotly parameters

steps : auto_steps,

if it does not work, can you provide a fake/dummy representation of your data?
that way i am able to run the script on a table with the same header
and debug it until it works…

1 Like

Thanks Paolo for the response.

I have been working based on the work of marco_ghislanzoni. I have just a little knowledge on JavaScript and with that, i understood part of the code that you made, but i still dont make it more simple.
I have add the workflow for you to see and have a better understanding. If you can modify it to make it more simple using a loop, I will be grateful.

jodomofo

animated point graph.knwf (9.8 KB)

Hi again paolotamag

I did the modification to the code, as you suggested, but it shows a blank results. The approach that you recommended was logical to me, but don’t now what is causing the crash. Besides, is the second part of the code, in the frame’s part.

I have added the workflow , with the original-working code and the node with the recommendation that you suggested. I also uploaded a file in excel with a data example, for you to see and have a better understanding. If you can modify it to make it more simple using a loop, I will be grateful.

Thanks again for your time

jodomofo

animated point graph.knwf (16.6 KB)
js1.xlsx (80.7 KB)

hey
this is the solution

it was merely about JavaScript coding syntax and logic…
not really about KNIME or plotly!

anyway i hope this get you started with plotly in KNIME!

polish the code a bit more to be even more flexible
and then share it here… with some interesting dataset though!

if it works out and the use case is interesting,
we could write a blog post together on the KNIME website!

cheers
Paolo

plotly_js.knar (54.7 KB)

Thanks a lot man !.
You right about it is something from logic.

I was checking it out, and all is ok, but the play button is not working…i mean, is there, but when i push it, the graph do no animate.

The problem is in the frame’s sub-routine. I replace it with the original data (the 60 records) and is working. Then the problem is not in the step’s section, but in the frame’s sub-routine.

I was looking at it (the frame’s part that you constructed, and i don’t see anything wrong. !

found the bug
before uploading I did one last fix to remove some supposedly useless rows
and i compromised the button
it should work now
plotly_js.knar (54.8 KB)

I have to thanks you paolotamag. I will now learn from what you did.
I have successfully copied some examples from the plotly web page (Plotly javascript graphing library in JavaScript). I have added here, for you to share, and for any one else who need help.

SomePlotLy.knwf (19.6 KB)

I have one more question…Can we do the same that we did, but instead of point plot, with a bar graph ( the idea is that the height of the bars, change in time).

thank you for the plotly snippets in that workflow!

animated barcharts were under development with plotly over a year ago:

I am not sure if it was finished since then

did you try to change the “mode” argument?

var data = [ { x: stop, y: h1, mode: ‘XXXXX’ } ];