I have been calculating a distance matrix for features of a dataset and used this to do a hierarchical clustering with this data.
Is there any way (using the Hierarchical Cluster View node) to display additional information (in this case the results of an independent classification) by e.g. coloring the branches/leaves of the tree - in analogy to using the Color Manager node)?
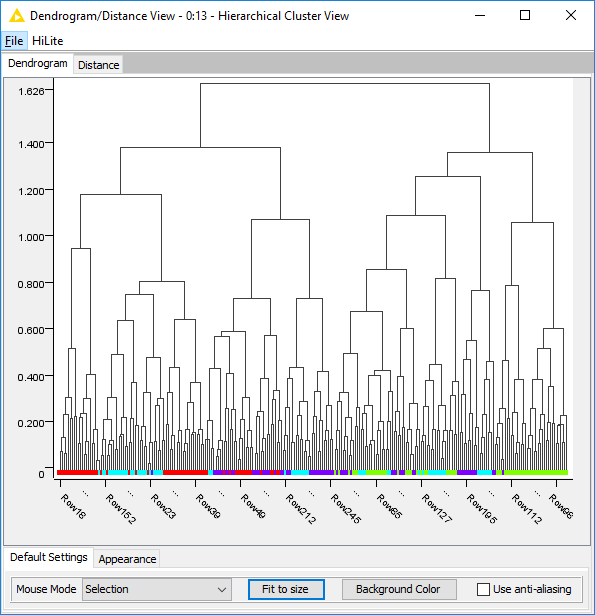
I don’t believe the Hierarchical Cluster View node supports coloring of the entire branches, but if you use the Color Manager node prior, you can indeed see colors for each individual leaf at the bottom of the plot. You might have to click the Fit to Size button in order to the see the colors.
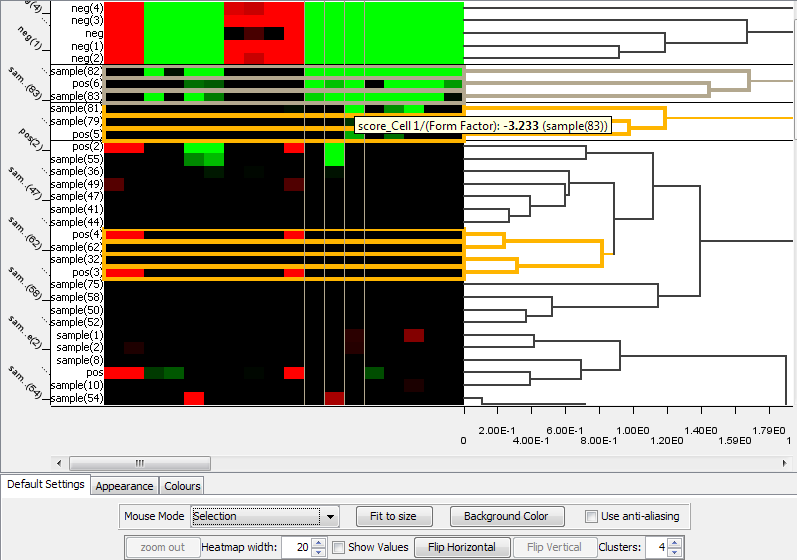
thank you for the link to your node - I will be sure to try it out as well, as the combination of heatmaps with dendrograms is very useful to the work I am doing here.