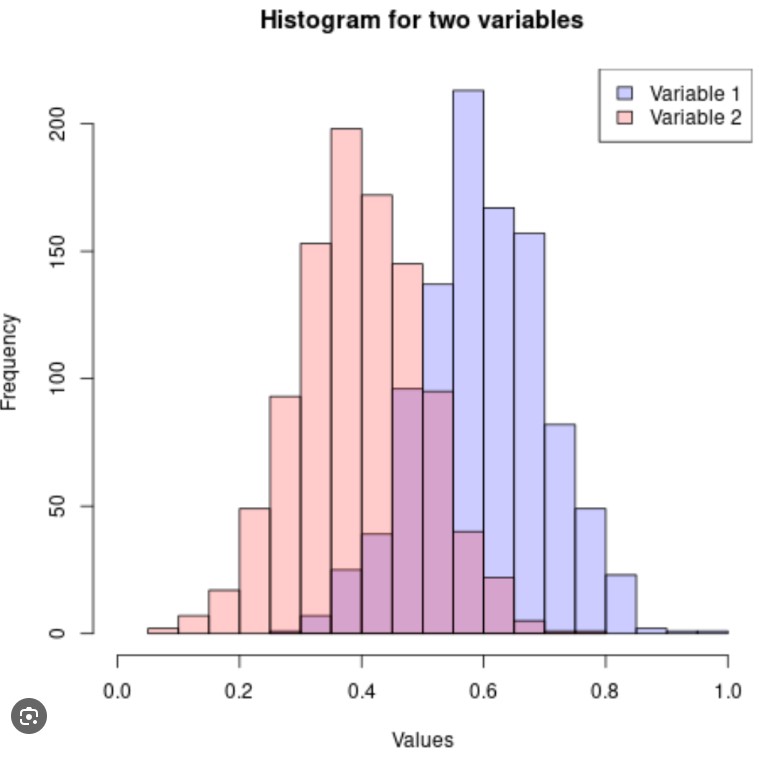
By adding the possibility to select a categorical column (which could be colored upfront using the Color Manager) one would be able to plot multiple histograms in the same plot, like so:
Thanks/Evert
By adding the possibility to select a categorical column (which could be colored upfront using the Color Manager) one would be able to plot multiple histograms in the same plot, like so:
Thanks/Evert
Hello @evert.homan_scilifelab.se ,
I am interested in what you try to do (e.g., how many categories do you expect; are you more interested in the overall shape of the distribution or the location/mean/median).
You may want to try the Density Plot – KNIME Community Hub that we released with the Early Access of KNIME Analytics Platform Version 5. It has an option “Condition Column”, which offers similar functionality.
Regarding the plot in the picture, I am a bit weary that it will be quite difficult to read it correctly. For example, there are three colors in the plot, but only two in the legend. It requires quite some experience to figure out that colors of the two groups mix, potentially it also could be the case that the bars are stacked. This will get more confusing when you add more categories. Thus, it would be interesting to understand your problem better. Maybe we can find a different solution.
Best regards,
nan
Hi, I think in most cases I would like to plot no more than 2-3 categories. A density plot would be a good alternative but you still will have the same ‘problem’ with overlapping regions between categories where the colors get mixed. But I think most people used to looking at plots like this will not find this problematic since the legend shows the exact number of categories and their colors.
Thanks/Evert