Honest critique of my workflow for school project

Hey guys,

This is my second post on Knime, thank you for all the help on the previous post.

I have a school project that required us to use Knime on a data set and complete 3 tasks, the professor I have for this course is pretty strict on how she marks so I want to get your thoughts on my workflow + report before I submit in hope to improve them.

This is the dataset that we worked on:
https://archive.ics.uci.edu/ml/machine-learning-databases/breast-cancer-wisconsin/breast-cancer-wisconsin.data

This is the description of the dataset:
https://archive.ics.uci.edu/ml/machine-learning-databases/breast-cancer-wisconsin/breast-cancer-wisconsin.names

These are the 3 tasks to be completed:

Task 1: Data Understanding and Preprocessing (30%)

Construct a KNIME workflow to understand the data characteristics and quality, report and discuss your findings. Based on the data understanding, identify and discuss the required data preprocessing steps, and perform them in the KNIME workflow. Also visualize the data on a 2D scatter plot, with colors showing the class labels.

Task 2: Classification (30%)

Next, add to or construct another KNIME workflow to build at least two classification models using the dataset by experimenting with at least two different algorithms and/or their hyperparameters. You can use any classification algorithms. In the report, describe the adopted algorithms, also discuss and justify your selection of algorithms and parameters. You may use experiments to support your discussions and justifications.

Task 3: Model Evaluation (20%)

Finally, add to the KNIME workflow to evaluate the trained models using appropriate performance measures and evaluation methods. In the report, describe the adopted performance measures and evaluation methods, discuss and justify your selection of performance measures and evaluation methods, present and analyse the results, also discuss the result reliability.

This is a link to my workflow, uploaded to the public-knime-hub:

And this is my report:

Also, this is a previous critique by my professor on my previous-work where I did pretty bad. I tried my best to amend all the mistakes.

Thank you in advance for any help.
Hi,
I just had a quick look at your workflow. There is a missing node in the middle and your nodes have no annotations. This makes the workflow difficult to understand at first glance. I would suggest you remove the red missing node and you add a comment under all nodes where it makes sense. That way, without downloading the workflow, people understand what it is doing only from the image on Community Hub.
Kind regards,
Alexander

2 Likes

Hi Alex,

Thank you.

I think the missing node was there because I didn’t have the extension on my Knime app ( moved between two diff versions)

I updated the workflow now, with comments under appropriate nodes.

Best
Muath

Hi @Muath,

also having a quick look at the workflow and the first chapter of getting to know the data you work with. Here are a few remarks to potentially improve the outcome:

  1. Keep a tidy workflow by enabling snap to grid. A well structured workflow helps you focusing on the primary objectives not wasting energy first on finding what you are looking for. Like the loose loop end @AlexanderFillbrunn pointed out :wink:
  2. Create components by selecting nodes which belong together, right click and chose create component. That further structures your workflow but also enables you to access the interactive view where you can look and several visual reports in a consolidated fashion.
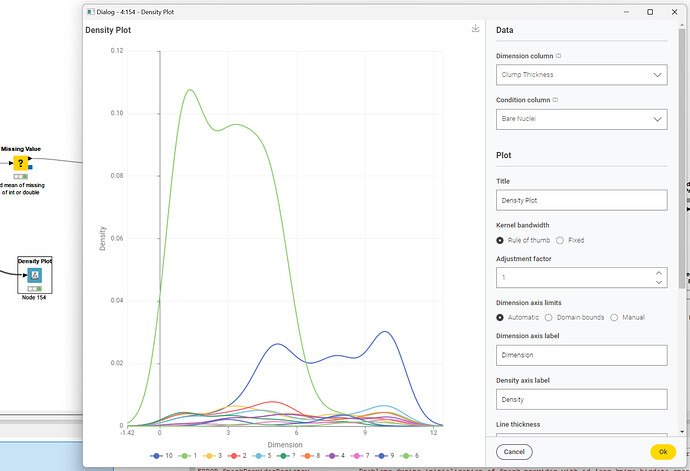
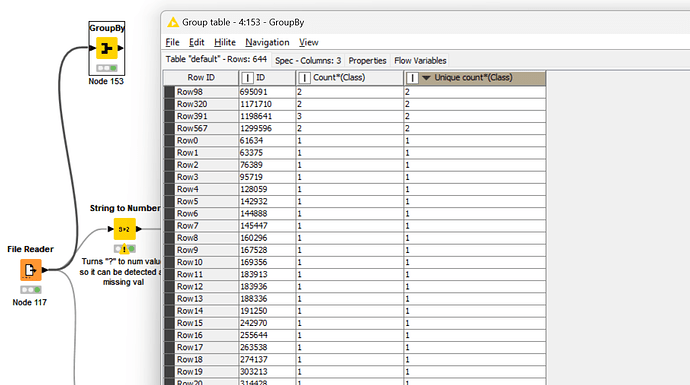
  3. About data quality. Use GroupBy to assess the values and their distribution amongst the classifications. Check for missing values. Check, for duplicates like these two I found and check the distribution using the density plot (below an arbitrary example)

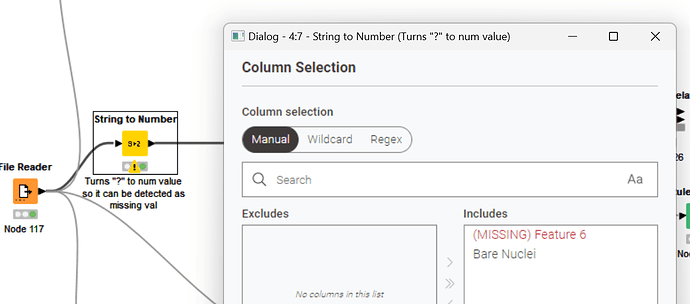
  4. The second node in your workflow has missing columns bringing me back to the first point to keep things tidy :wink:
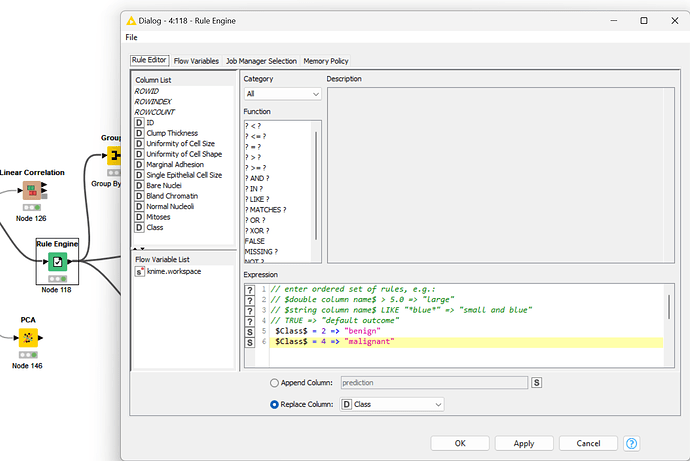
  5. The Rule Engine, as you configured, can have undesired side effects. If you do not define TRUE => YOUR-FALLBACK-DATA only the two conditions are met yielding a result and causing a missing value for everything that does not match your defined conditions. Or in other words, you might want to define a fallback to have control over the edge case eventually making that yellow in the color manager or using an if switch with a breakpoint.
  6. I am not an expert about statistics but if you create a sample set using the partitioner you might want to check if the sample set is of significant size. If not, you might want to apply data augmentation i.e. via Oversampling, Bootstrapping or Replication.
  7. The images in your PDF are difficult if not impossible to identify where they originated from in your Knime workflow. Maybe you add some annotiations?
  8. There is a nice node for statistical analysis as well as a view node available you might want to check out
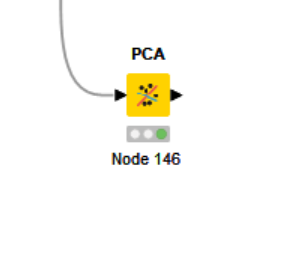
  1. Some nodes like PCA lack a note / documentation which would help you, later on in your classes, to come back and understand what you wanted to accomplish. Adding them also helps to reconfigure them in case the data set changes.

image

  1. One more thing. You might want to use, based on the density plot, decide to run a t-test for significance and statistical error testing.

https://hub.knime.com/search?type=all&tag=Hypothesis%20Testing&sort=maxKudos

I hope this helps.

Best
Mike

1 Like

This topic was automatically closed 90 days after the last reply. New replies are no longer allowed.