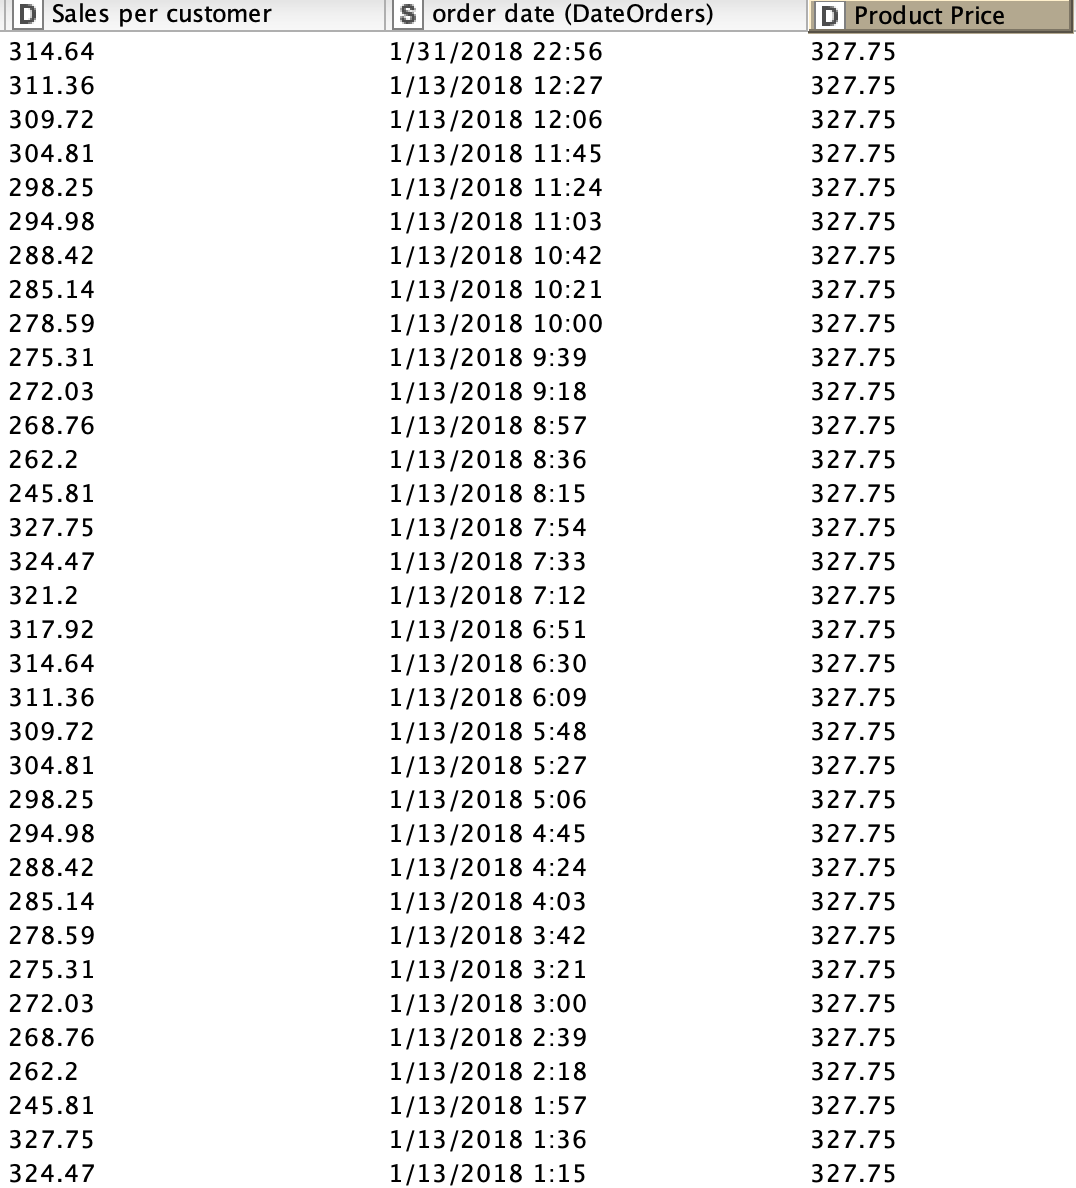
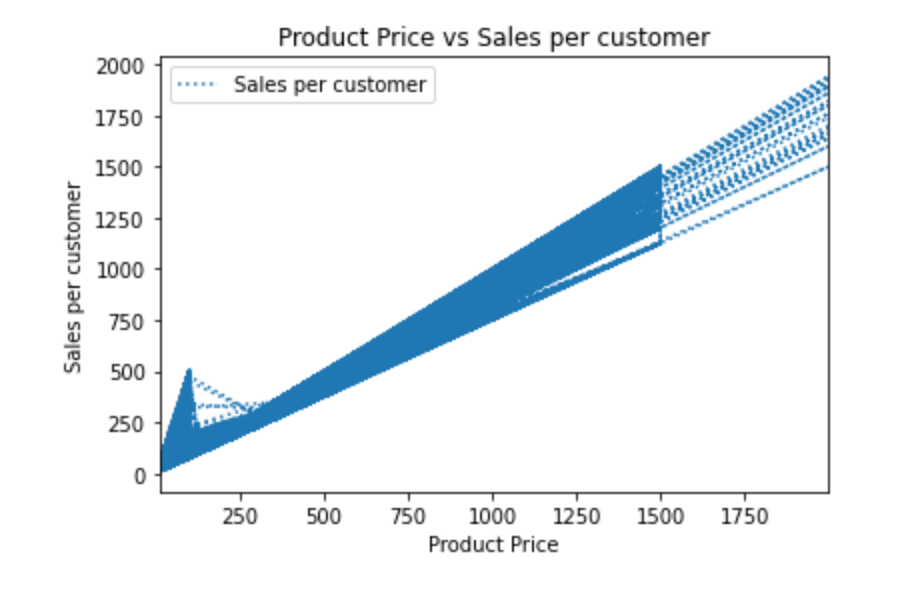
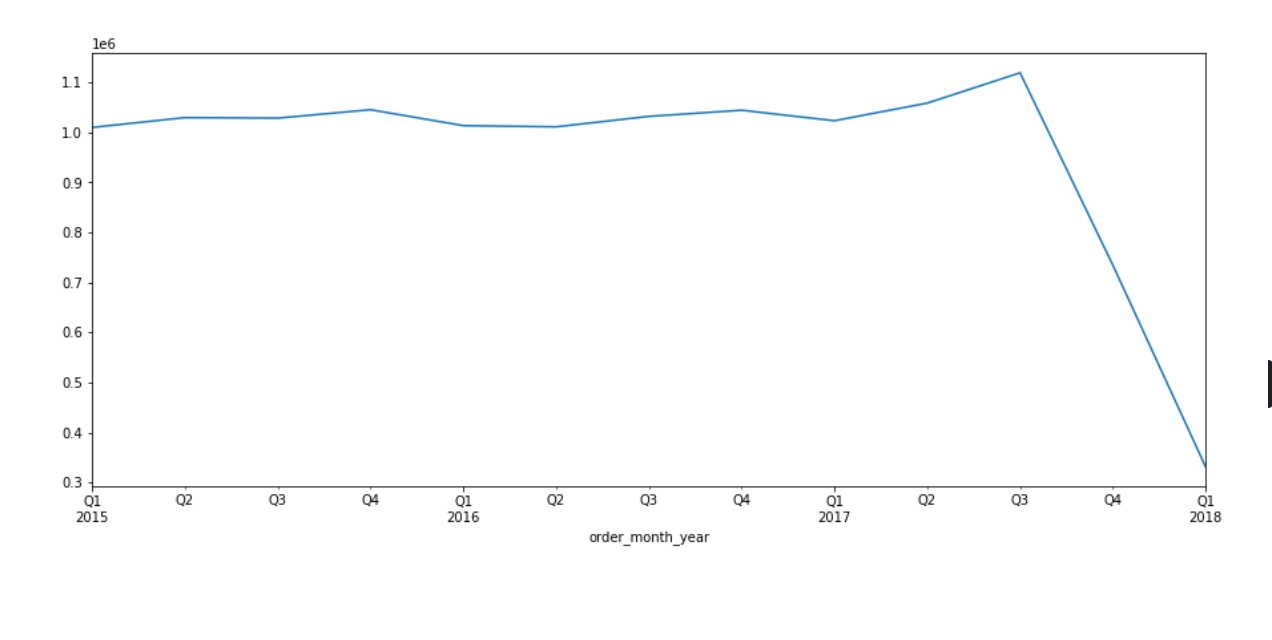
I created line plot between two columns (Sales per customer and Product Price). I have a third column which is the order date. I would like to observed this relation in different times. For example 2018/2019/2020 (year) or 03.2018/ 06.2018/ 09.2018 (quarter).
Any suggestions?
Hello @ppeng
I don’t fully get the scope of the question…
Do you want to represent this mentioned classes in the chart legend (colors)? or do you want to slice the data represented in the chart? or both?
In any case, if you want it dynamic by selectors (dashboard style), I would suggest to build it within a component. You can create selectors [legend (yearly, quarterly), slicing (time bounds)] with widget nodes and a refresh button.
Even if you are asking just for help with node functions, sharing your sample workflow would make easier for others to collaborate.
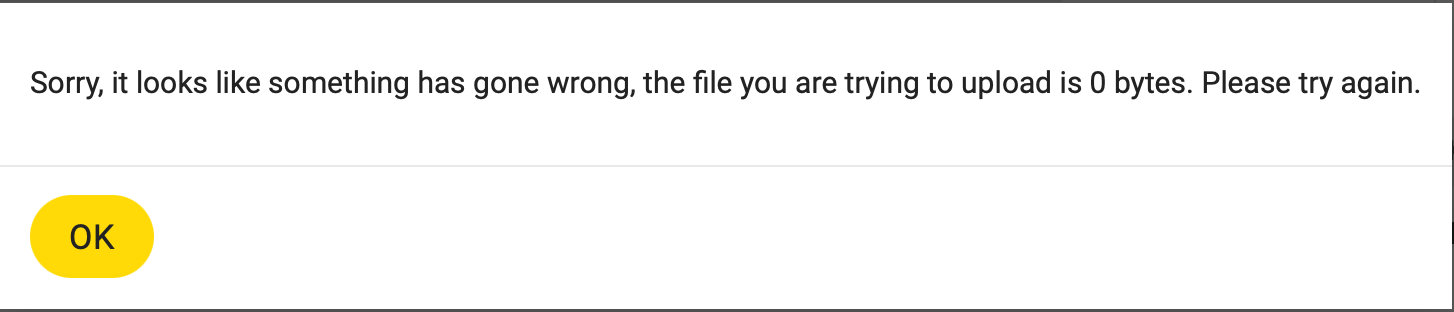
yes sorry, but for some reason I can’t upload the workflow. It keeps saying this:
Even though I checked a few times and the file should not have a problem…